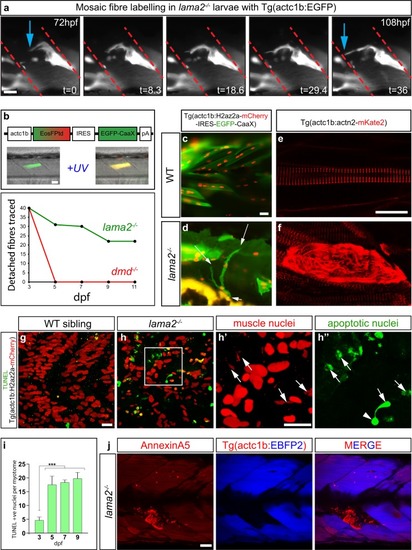
Dystrophic fibres in lama2−/− larvae undergo extensive remodelling prior to undergoing cell death. a Still frames of continuous time-lapse analysis (Supplementary Movie 1) of mosaic labelled actc1b:GFP dystrophic fibres in lama2−/− larvae reveals extensive remodelling and reattachment (blue arrows) to the matrix-rich regions of the vertical myosepta (red dashed lines). Time (t) is indicated in minutes. b Tracing of single dystrophic fibres in lama2−/− and dmd−/− larvae reveals lama2−/− dystrophic fibres are long lived compared to those evident dmd−/− animals. c, d Fibre remodelling is evident in dystrophic fibres in lama2−/− larvae mosaically injected with an act1b:H2az2a-mCherry-IRES-EGFP-CaaX construct, which marks differentiated muscle nuclei in red and plasma membrane in green. This analysis identified extensive fibre branching (arrows, d) of an individual dystrophic fibre that was not evident in wildtype siblings similarly injected (c). e, f Fibres transgenically marked mosaically with the alpha-actinin-mKate2 fusion protein expressed shows the formation of new pre-myofibrils in the dystrophic context (f), compared to Z-line associated in the wildtype (e). g–i Dystrophic fibres in lama2−/− animals undergo a delayed cell death. An increase in cell death is only seen at 5 dpf within the myotome of lama2−/− larvae, several days after the onset of dystrophic pathology. g, h″ TUNEL staining (Green) in wildtype sibling (g) and lama2−/− larvae (h–h″) transgenic for Tg(actc1b:H2az2a-mCherry), which marks muscle nuclei in red, reveals the increase in cell death in muscle nuclei in lama2−/−. h′ and h″ are high magnification views of the region marked in h. i Quantitation of TUNEL-positive muscle nuclei in the myotomes of lama2−/− animals. Significance is tested in a one-way ANOVA, Tukey’s test; ***p < 0.001. Results are expressed as a mean ± SD. j Secreted annexin5-mKate2 (red, arrows), which marks cells undergoing cell death, is specific for regions of fibre loss in 5 dpf larvae. Blue marks intact muscle fibres in Tg(actc1b:EBFP2) larvae. Scale bars, 20 μm
|
