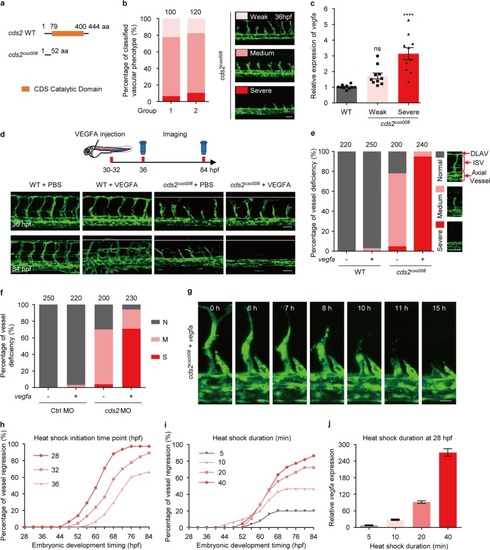
VEGFA induces vessel regression in cds2-deficient zebrafish. a Diagram of zebrafish cds2 mutant allele cas008 (cds2cas008). b Quantification of classified vascular phenotypes in cds2 mutant embryos at 36 hpf. The right panel shows the representative images of weak, medium and severe vascular defects in cds2 mutant embryos within Tg(fli1a:eGFP) transgenic background. The counted embryo number is shown on the top of bar graph. c Relative vegfa expression in 36 hpf WT and cds2 mutant embryos within two phenotypic subtypes. n = 10 samples per group, 10 embryos pooled for each sample. d Confocal images of trunk vessels from 36 and 84 hpf WT and cds2 mutant embryos injected with VEGFA protein or PBS. White lines indicate the dorsal position where ISVs in WT embryos can reach. The top panel represents timing for venous microinjection (CCV) and confocal imaging analysis. e Quantification of vascular deficiency in the embryos (Fig. S1e) at 84 hpf. Bars show percentage of classified ISVs that have grown to the dorsal trunk (Normal), to the myoseptum (Medium) or regressed to the axial vessels (Severe). Representative images for 3 classified phenotypes are shown on the right. The counted ISV number from 20–25 embryos per group (10 trunk segments counted per embryo) is shown on the top bar graph. DLAV, dorsal longitudinal anastomotic vessel. f Quantitative analysis of trunk vessels in WT and cds2 MO-injected embryos with or w/o vegfa OE. The quantified ISV number shown on the top graph is from 20–25 embryos per group. N, normal; M, medium; S, severe. g Time-lapse imaging analysis on cds2 mutants with Tg(fli1a:eGFP) transgenic background and vegfa OE during 52–72 hpf, showing ISV regression process. h, i Time-lapse phenotype analysis on vessel regression events under different heat shock initiation time points (h, embryos were heat-shocked for 1 h at 28, 32 or 36 hpf, n = 300 ISVs counted from 30 embryos) and various heat shock durations (i, n = 300 ISVs counted from 30 embryos). j Relative vegfa expression of Tg(hsp:vegfaa) embryos challenged with different heat shock durations. vegfa level was determined at 2–4 h after heat shock induction and normalized to wild type embryos under the same experimental conditions. n = 4 samples per group, 20 embryos pooled for each sample. Scale bars, 50 μm (b and d; 36 hpf), 70 μm (d; 84 hpf), 100 μm (e) and 20 μm (g). Error bars, mean ± SEM. Statistical significance between the indicated sample versus WT is ****P < 0.0001 or ns, not significant (P ≥ 0.05). See also Supplementary information, Fig. S1
|
