|
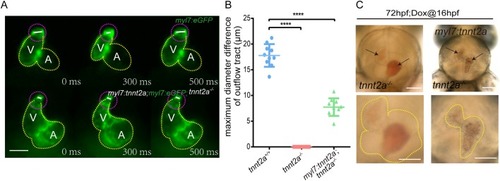
Mechanical behaviours of OFT are deregulated in tnnt2a mutant zebrafish with myocardial tnnt2a supplementation. (A) Representative images of the OFT morphologies at systole and diastole stages of a cardiac cycle. V, ventricle; A, atrium; yellow dotted line, heart outline; white line, OFT diameter; purple dotted line, OFT outline. Scale bar: 100 µm. (B) Statistics of maximum diameter difference of OFT in tnnt2a+/+, tnnt2a−/− and Tg(myl7:tnnt2a); tnnt2a−/−. ****P<0.0001; n=30 per group. Statistical differences were evaluated using Kruskal–Wallis test. (C) Images of the stacked blood cells in the heart chambers of tnnt2a−/− and Tg(myl7:tnnt2a); tnnt2a−/− zebrafish at 72 hpf. Arrows show the stacked red blood cells. Scale bars: 100 µm.
|