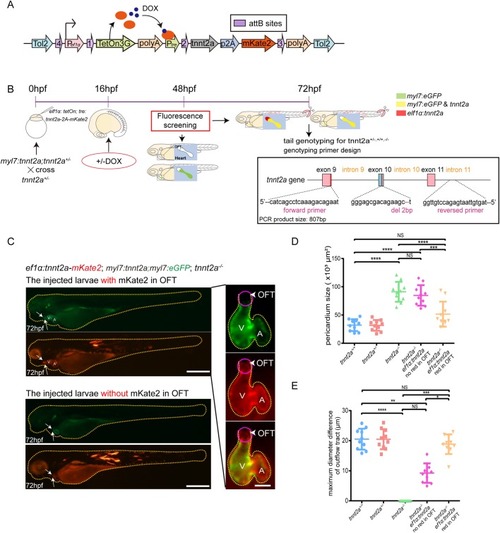
Replenishments of tnnt2a in both myocardial cells and OFT significantly recover the heart function of tnnt2a mutant zebrafish. (A) Structure of the transgenic vector for rescue injection. (B) Schematic workflow of the double-rescue experiments and phenotyping/genotyping. (C) Left: representative images of Tg(myl7:tnnt2a); tnnt2a−/− zebrafish injected by eflα:tetOn; tre:tnnt2a-p2A-mKate2 [eflα:tnnt2a] with and without red fluorescence in OFT. Right: representative images of Tg(myl7:tnnt2a); tnnt2a−/− with additional eflα:tnnt2a in OFT. Yellow dotted lines, whole larvae or heart outlines; arrows and purple circle, mKate2-positive and eGFP-negative regions; V, ventricle; A, atrium; arrows and arrowheads, outflow tract. Scale bars: (lateral view) 200 µm, (ventral view) 150 µm. (D,E) Statistics of the maximum diameter difference of the OFT and pericardium size in tnnt2a+/+, tnnt2a+/−, tnnt2a−/−, Tg(myl7:tnnt2a); tnnt2a−/− injected by eflα:tetOn; tre:tnnt2a-p2A-mKate2 [eflα:tnnt2a] with and without red fluorescence in OFT. *P<0.05, **P<0.01, ***P<0.001, ****P<0.0001, NS, not significant; n=30 per group. Statistical differences were evaluated using one-way ANOVA (D) and Kruskal–Wallis test (E).
|
