
Figure 6
- ID
- ZDB-FIG-190723-2689
- Publication
- Jiang et al., 2019 - A conserved morphogenetic mechanism for epidermal ensheathment of nociceptive sensory neurites
- Other Figures
-
- Fig. 1
- Fig. 1-S1
- Fig. 1-S2
- fig2
- fig3
- Figure 2—figure supplement 1.
- Figure 3—figure supplement 1.
- Figure 4
- Figure 4—figure supplement 1.
- Figure 4—figure supplement 2.
- Figure 4—figure supplement 3.
- Figure 5
- Figure 5—figure supplement 1.
- Figure 5—figure supplement 2.
- Figure 5—figure supplement 3.
- Figure 6
- Figure 6—figure supplement 1.
- Figure 6—figure supplement 3.
- Figure 7—figure supplement 1.
- All Figure Page
- Back to All Figure Page
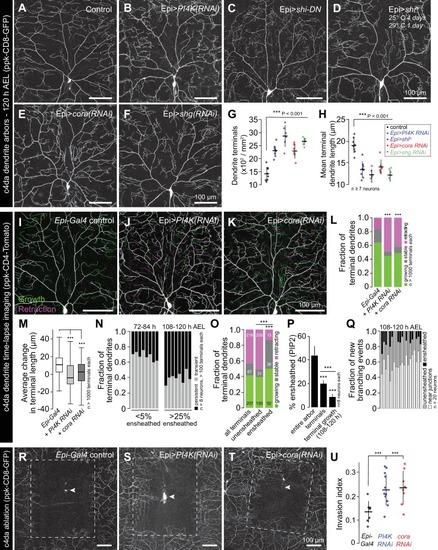
Representative images of 120 h AEL c4da neurons from ( A) control larvae and larvae expressing ( B) PI4K(RNAi), ( C) dominant-negative shibire (shiDN), ( D) temperature-sensitive shibire ( shits), ( E) epidermal cora(RNAi), and ( F) epidermal shg(RNAi) larvae are shown. Larvae were reared at 25° C, with the exception of larvae in ( D) which were reared at 25° C for 4 days and then shifted to the non-permissive temperature 29° C for 1 day prior to imaging. ( G–H) Morphometric analysis of dendrites from c4da neurons of the indicated genotypes. Plots show mean and standard deviation for ( G) the number of terminal branches and ( H) terminal branch length. Data points, measurements from an individual neuron; ***p<0.001 relative to control; one way ANOVA with post-hoc Dunnett’s test. ( I–L) Time-lapse analysis of epidermal sheath control of terminal dendrite dynamics. C4da neurons were imaged over an 18 h time-lapse (96–114 h AEL) and growth (green) and retraction (magenta) were pseudocolored in a composite of the two time-points. Representative composite images are shown for c4da neurons from ( I) Gal4-only control, ( J) epidermal PI4K(RNAi), and ( K) epidermal cora(RNAi) larvae. ( L–P) Quantification of terminal dendrite dynamics. ( L) The fraction of terminal dendrites that were growing, stable, or retracting over the time-lapse is shown. ***p<0.001 compared to controls, Chi-square analysis. ( M) Epidermal ensheathment regulates the extent of terminal dendrite dynamics. Box plots depict mean values and 1st/3rd quartile, whiskers mark minimum/maximum values. ***p<0.001 compared to Epi-Gal4 control; one way ANOVA with post-hoc Dunnett’s test. ( N) Epidermal ensheathment regulates dendrite turnover. C4da neurons were imaged over a 12 h time-lapse (72–84 or 108–120 h AEL) and all terminal dendrites were scored as persistent (present at both time points) or transient. Each bar represents measurements from a single neuron. Terminal dendrites at the later time-point, when c4da neurons are extensively ensheathed, were significantly more likely to persist. ( O) Quantification of terminal dynamics in ensheathed and unensheathed terminal dendrites from 108 to 120 h AEL. ***p<0.001, Chi-square analysis with post-hoc Bonferroni adjustment for multiple comparisons. Pairwise comparisons are indicated. ( P) Dynamic portions of dendrite arbors are less extensively ensheathed. Mean and standard deviation values for the proportion of c4da dendrite arbors, terminal dendrites, and new terminal dendrite growth (12 h time-lapse) wrapped by PLCδ-PH-GFP sheaths at 120 h AEL. ***p<0.001, Chi-square analysis with post-hoc Bonferroni adjustment for multiple comparisons. Pairwise comparisons are indicated. ( Q) Distribution of branching events during 12 h time-lapse imaging. Each bar represents a single neuron. ( R–U) Epidermal ensheathment regulates dendrite structural plasticity. Class IV neurons in newly eclosed 2nd instar control ( R), epidermis PI4k(RNAi) ( S), and epidermis cora(RNAi) ( T) larvae were ablated with a focused laser beam and imaged 48 h post-ablation. Images depict dendrite growth of spared neurons into unoccupied territory following laser ablation and hatched boxes demarcate the territory occupied by the ablated neuron. ( U) Scatter plot depicting mean and standard deviation for dendrite invasion of the indicated mutants. The number of samples analyzed for each treatment is indicated. ***p<0.001 relative to control; one way ANOVA with post-hoc Dunnett’s test. |