
fig3
- ID
- ZDB-FIG-190723-2679
- Publication
- Jiang et al., 2019 - A conserved morphogenetic mechanism for epidermal ensheathment of nociceptive sensory neurites
- Other Figures
-
- Fig. 1
- Fig. 1-S1
- Fig. 1-S2
- fig2
- fig3
- Figure 2—figure supplement 1.
- Figure 3—figure supplement 1.
- Figure 4
- Figure 4—figure supplement 1.
- Figure 4—figure supplement 2.
- Figure 4—figure supplement 3.
- Figure 5
- Figure 5—figure supplement 1.
- Figure 5—figure supplement 2.
- Figure 5—figure supplement 3.
- Figure 6
- Figure 6—figure supplement 1.
- Figure 6—figure supplement 3.
- Figure 7—figure supplement 1.
- All Figure Page
- Back to All Figure Page
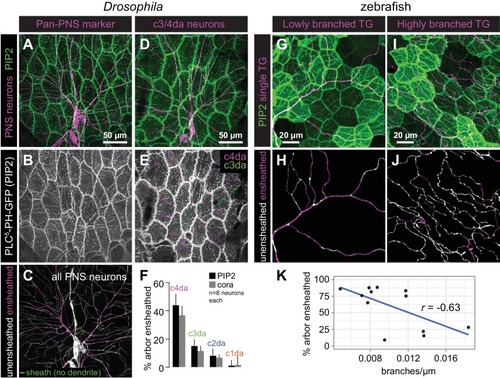
Epithelial sheaths form adjacent to somatosensensory neurons in a modality-specific manner.( A–C) Dual-labelling of epithelial sheaths and all somatosensory neurons. Maximum projections of confocal stacks show ( A) mRFP-labeled sensory neurons (magenta) together with epidermal PLCδ-PH-GFP signal (green) or ( B) epidermal PLCδ-PH-GFP signal on its own. ( C) PLCδ-PH-GFP-positive sheaths are pseudocolored with dendrite-associated sheaths shaded in magenta and sheaths without apposed dendrites shaded in green. ( D, E) Dual-labeling of epithelial sheaths and c3da/c4da sensory neurons. ( D) tdTomato-labeled c3da and c4da neurons (magenta) are shown together with epidermal PLCδ-PH-GFP signal (green). ( E) Image showing epidermal PLCδ-PH-GFP signal with c3da-containing sheaths shaded green and c4da-containing sheaths shaded magenta. ( F) Histogram depicting mean and standard deviation values for the portion of the dendrite arbor of different classes of da neurons ensheathed by the epidermis using PLCδ-PH-GFP or cora immunostaining as a marker for ensheathment. ( G–K) The extent of ensheathment was inversely correlated with trigeminal (TG) axon complexity in zebrafish. Examples of single TG neurons labeled by transient injection of Tg(isl1[ss]:LEXA-VP16,LEXAop:tdTomato) with low ( G, H) or high ( I, J) branch density. Epidermal sheaths are shaded in magenta in ( H, J). ( K) Scatterplot of axon branches versus percentage of axon length ensheathed from tracings of 12 individual TG neurons. Note the inverse linear regression (blue line) |