
Fig. 3
- ID
- ZDB-FIG-190723-1088
- Publication
- Gong et al., 2019 - Sec14l3 potentiates VEGFR2 signaling to regulate zebrafish vasculogenesis
- Other Figures
- All Figure Page
- Back to All Figure Page
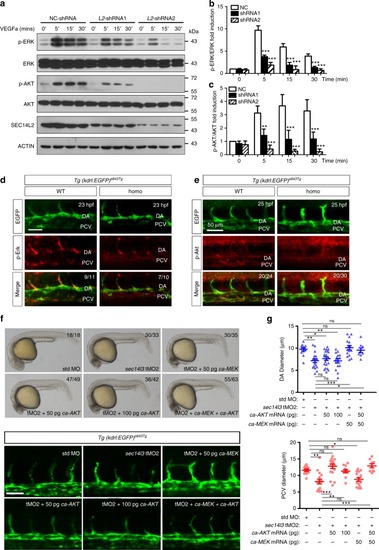
SEC14L2/sec14l3 knockdown attenuates VEGF signaling. a SEC14L2knockdown counteracts VEGFa-motivated p-ERK and p-AKT levels in HUVECs. HUVECs were infected with NC or SEC14L2 shRNA for 48 h. After VEGFa stimulation for 5, 15 or 30 min, cell lysates were harvested and immunoblotted with indicated antibodies. b, c Statistical results of relative p-ERK (b) and p-AKT (c) levels in a. The grey intensity of each band was measured for calculating the ratio of p-ERK to ERK (b) and p-AKT to AKT (c). Data are then normalized to control group with 0’ stimulation and represented as mean ± SEM from three independent experiments. d–eDepletion of sec14l3 decreases p-Erk (d) and p-Akt (e) levels in zebrafish embryos. Embryos from intercrossing sec14l3 heterzygous in Tg(kdrl: GFP)s843Tg transgenic background were harvested at 23 hpf for p-Erk antibody immunostaining (d) or at 25 hpf for p-Akt antibody staining (e). DA, dorsal aorta. The ratio in the right corner indicates the number of embryos with reduced staining/the number of observed embryos. Scale bars, 50 μm. f The defective DA/PCV lumen formation in sec14l3 morphants can be partially rescued by ca-MEK or ca-AKT mRNA injection. Five nanograms std-MO or sec14l3-tMO2 in combination with 50 or 100 pg ca-MEK or ca-AKT mRNA was injected into one-cell stage embryos. Their morphology (the upper panel) or vasculature defects (the bottom panel) at 25 hpf are separately shown. The ratio in the right corner indicates the number of embryos with indicated morphology/the number of observed embryos. Scale bars, 50 μm. g Statistic results of the DA (upper panel) or PCV (bottom panel) luminal diameters of each group at 30 hpf. Twenty embryos of each group from one representative experiment were calculated and shown here. To quantify the DA and PCV luminal diameter for an embryo, five different vessel regions of the same fish were measured to calculate the mean value, which was used to represent its vessel diameter of this fish. Three independent experiments were carried out. *p < 0.05; **p < 0.01; ***p < 0.001; ns, not significant. ANOVA tests were used for statistical analyses. Source data are provided as a Source Data file |
| Antibodies: | |
|---|---|
| Fish: | |
| Anatomical Term: | |
| Stage Range: | 26+ somites to Prim-5 |
| Fish: | |
|---|---|
| Knockdown Reagent: | |
| Observed In: | |
| Stage Range: | 26+ somites to Prim-5 |