
Fig. 2
- ID
- ZDB-FIG-190723-1087
- Publication
- Gong et al., 2019 - Sec14l3 potentiates VEGFR2 signaling to regulate zebrafish vasculogenesis
- Other Figures
- All Figure Page
- Back to All Figure Page
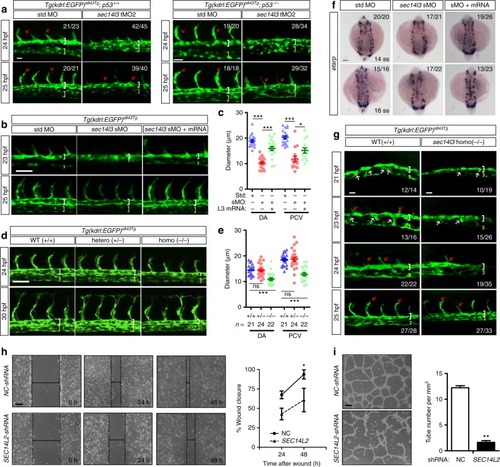
sec14l3/SEC14L2 are required for vascular formation in vivo and in vitro. asec14l3-tMO injection impairs arterial-venous segregation and luminal formation in zebrafish. Embryos of Tg(kdrl:EGFP)s843Tg;p53+/+ (left panel) or Tg(kdrl:EGFP)s843Tg;p53−/− fish (right panel) were used. White and yellow brackets indicate DA and PCV respectively; red arrows indicate ISVs sprouting. The ratio in the right corner indicates the number of embryos with observed pattern/the total number of observed embryos. b sec14l3-sMO mediated knockdown of sec14l3 causes trunk vascular defects. 0.5 ng sec14l3-sMO and 150 pg sec14l3 mRNA were co-injected for rescue experiment. c Statistical analyses of DA and PCV diameters at 25 hpf in b(n = 20 embryos). d Vasculature defects in sec14l3 mutant embryos. Heterozygous mutants were intercrossed and embryos were harvested for vasculature observation and genotyping analysis individually. e Statistical analyses of DA and PCV diameters at 30 hpf in d. The total number of embryos in each genotype is indicated. f sec14l3-sMO injection causes angioblast migration defects. 0.5 ng sec14l3-sMO and 100 pg sec14l3mRNA were co-injected for rescue experiment. WISH using etsrp probe marks the medial (arrowhead) and lateral (arrow) progenitor populations simultaneously. g Ventral sprouting defects in sec14l3 mutant embryos. hSEC14L2 knockdown inhibits the in vitro wound closure process. HUVECs infected with control or SEC14L2 shRNA were used for wound closure observation. The ratio of recovered wound width at a specific time point post-wounding to the initial wounding width was calculated. Dashed lines indicate wound edges. Statistical data are shown (n = 3). i SEC14L2knockdown inhibits in vitro tube formation. HUVECs were infected with shRNA-packed lentivirus and the complete tube number was scored per field at 24 h after plating. The statistical data are shown on the right (n = 3 independent experiments, 60 fields total). All statistical data are shown as mean ± SEM. One-way ANOVA tests were used for statistical analyses in c, e and t-tests were used for h–i. *p < 0.05; **p < 0.01; ***p < 0.01; ns, not significant. Scale bars, 25 μm for a, 50 μm for b, d, g, and h–i, 100 μm for f. Source data are provided as a Source Data file |
| Gene: | |
|---|---|
| Fish: | |
| Knockdown Reagent: | |
| Anatomical Term: | |
| Stage: | 14-19 somites |
| Fish: | |
|---|---|
| Knockdown Reagents: | |
| Observed In: | |
| Stage Range: | 14-19 somites to Prim-15 |