
Fig. 6
- ID
- ZDB-FIG-190723-1094
- Publication
- Gong et al., 2019 - Sec14l3 potentiates VEGFR2 signaling to regulate zebrafish vasculogenesis
- Other Figures
- All Figure Page
- Back to All Figure Page
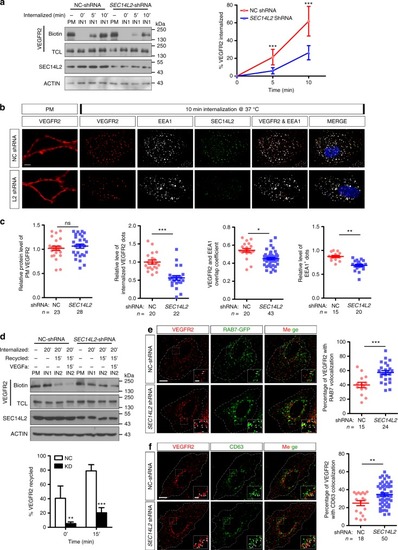
SEC14L2 knockdown disturbs VEGFR2 internalization and recycling processes. a Western blotting results show impairment of biotinylated VEGFR2 internalization in SEC14L2 knockdown cells. VEGFR2-overexpressing HEK293T cells were transfected with NC or SEC14L2shRNA for internalization assay described as supplementary Fig. 10. Quantified internalized VEGFR2 levels are shown on the right as mean ± SD from three independent experiments (n = 3). Red and blue lines represent control and SEC14L2 shRNA transfected group, respectively. TCL, total cell lysate. ***p < 0.001. b, c Analysis of VEGFR2 internalization based on immunostaining assay in HUVECs. HUVEC cells infected with NC or SEC14L2 shRNA were cultured for internalization assay and then cells were fixed for immunostaining with anti-EEA1 (white) and anti-SEC14L2 (green) antibodies. Quantification data of plasma membrane VEGFR2 (red) before internalization, internalized VEGFR2 after internalization, overlapping coefficient between internalized VEGFR2 and EEA1 (n = 40 cells) as well as EEA1 positive dots are shown individually in c. *p < 0.05; **p < 0.01; ***p < 0.001; ns, not significant. d Western blot analysis of VEGFR2 recycling over a 35 min time course. VEGFR2-overexpressing HEK293T cells were transfected with NC- or SEC14L2 shRNA for 48 h and used for recycling assay as detailed in Supplementary Fig. 10. The recycling rate of VEGFR2 was measured with or without 100 ng ml−1 VEGFa stimulation. Quantification data are shown as mean ± SD from three independent experiments on the right (n = 3). **p < 0.01; ***p < 0.001. e, f SEC14L2knockdown promotes VEGFR2 localization in RAB7+ (e) or CD63+ (f) compartments. HUVEC cells infected with NC or SEC14L2 shRNA were transfected with RAB7-EGFP (e) or harvested directly (f) for anti-VEGFR2 (red) and EGFP/CD63 (green) staining. Regions in the boxes are enlarged in the right corner. Scale bars, 10 μm. The percentage of VEGFR2 co-localized with RAB7/CD63 is shown individually in the right, n indicates observed cell number. **p < 0.01; ***p < 0.001. Two-way ANOVA tests were used for a, d and t-tests for c, e, and f. Source data are provided as a Source Data file |