
Fig. 3
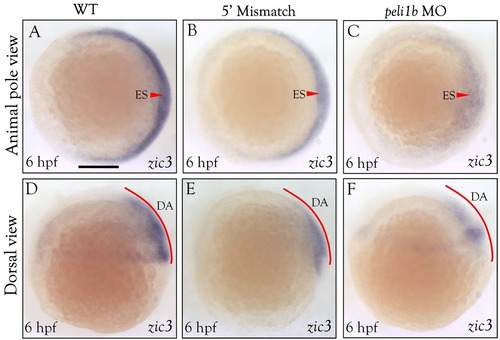
WISH distribution analysis of zic3 in peli1bmorphants at the shield stage. Animal pole view of zebrafish embryos at the shield stage (A–C). Dorsal view of zebrafish embryos at the shield stage (D–F). Images for WT (A & D), 5′ mismatch (B & E), and peli1b morphants injected with 10 ng morpholino at the 1-cell stage (C & F). Red arrowheads show zic3 expression and intensity in WT, 5′ mismatch, and peli1b morphants. The animal-pole view shows that the embryonic shield (EM) area has lower expression of zic3 transcripts in the peli1b knockdown embryos than in WT embryos. The dorsal view shows the reduced expression of zic3 in peli1b MO embryos. (n = 3). Abbreviation: ES- embryonic shield, DA- dorsal area. Scale bar- 50 μm. (For interpretation of the references to color in this figure legend, the reader is referred to the web version of this article.) |
| Gene: | |
|---|---|
| Fish: | |
| Knockdown Reagent: | |
| Anatomical Term: | |
| Stage: | Shield |
| Fish: | |
|---|---|
| Knockdown Reagent: | |
| Observed In: | |
| Stage: | Shield |
Reprinted from Gene, 694, Kumar, A., Anuppalle, M., Maddirevula, S., Huh, T.L., Choe, J., Rhee, M., Peli1b governs the brain patterning via ERK signaling pathways in zebrafish embryos, 1-6, Copyright (2019) with permission from Elsevier. Full text @ Gene