
Fig. 1
- ID
- ZDB-FIG-190620-23
- Publication
- Knogler et al., 2019 - Motor context dominates output from Purkinje cell functional regions during reflexive visuomotor behaviours
- Other Figures
- All Figure Page
- Back to All Figure Page
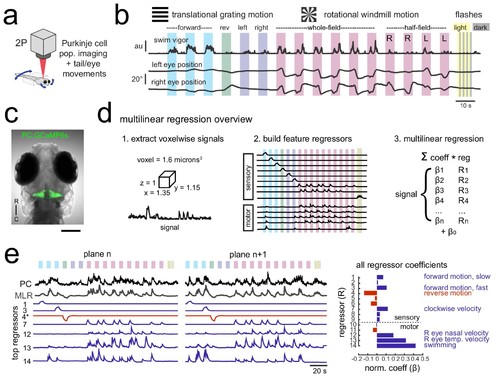
Using population imaging and multilinear regression to describe feature responses across the Purkinje population during visuomotor behaviors. (a) Cartoon of the embedded zebrafish preparation under the two-photon microscope with freely-moving eyes and tail. (b) Overview of the visual stimuli presented to the awake, behaving zebrafish during volumetric two-photon calcium imaging. See Materials and methods for further details. The mean swimming activity and eye position for a representative fish across an entire experiment is shown (N = 100 trials). (c) Composite bright field image of a seven dpf zebrafish larva from a dorsal view showing Purkinje cells expressing GCaMP6s driven by a ca8 enhancer element. Scale bar = 100 microns. (d) Overview of the multilinear regression analysis. See Materials and methods for additional details and see Figure 1—figure supplement 1 for full list of regressors. (e) Left panels, example calcium signal from a Purkinje cell across two planes (black trace) can be well recapitulated through multilinear regression (MLR, grey trace; R2 = 0.77). The regressors with the seven largest coefficients (β) are shown below scaled in height and colored by their β value (blue = positive, red = negative). The asterisk for regressor four refers to a negative value of β which results in an inverted regressor. Right, a bar graph quantifying the normalized β values for all regressors for this cell with the regressors shown at left labelled. See also Figure 1—figure supplements 1 and 2. |