
Fig. 6
- ID
- ZDB-FIG-190806-13
- Publication
- Knogler et al., 2019 - Motor context dominates output from Purkinje cell functional regions during reflexive visuomotor behaviours
- Other Figures
- All Figure Page
- Back to All Figure Page
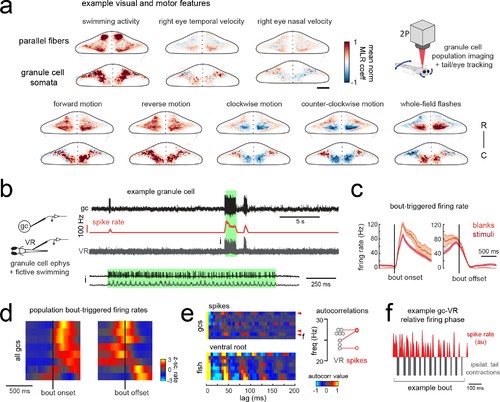
Granule cells across the cerebellum code for motor activity with high fidelity.(a) Heatmaps of the z-projected mean voxelwise correlation coefficients of two-photon granule cell GCaMP6s signals from multilinear regression with example sensory and motor regressors averaged across seven fish (see Materials and methods). Scale bar = 50 microns. Upper right, cartoon of experimental set-up. (b) Left, cartoon of experimental set-up. Right, upper panel, example cell-attached recording from a granule cell (gc, upper trace, black) from a blank trial with simultaneous ventral root recording (VR, lower trace, gray). The granule cell firing rate is also shown (spike rate, middle trace, orange). The bout highlighted in green (i) is shown below on an expanded timescale. (c) The bout on- (left) and off- (right) triggered mean firing rates for this granule cell during blank recordings (orange) and stimulus trials (red). (d) Z-scored heatmaps of bout on- (left) and off- (right) triggered mean firing rates in all granule cells sorted by mean firing rate in the 300 ms following bout onset (N = 8 cells from eight fish). (e) Mean autocorrelation heatmap for spikes (upper panel) and ventral root recordings (VR, lower panel) for all granule cells from d), sorted by time to first peak in the VR autocorrelation. The red arrowheads signify granule cells with significant spike autocorrelations during fictive swim bouts (N = 3; p<0.001, Ljung-Box Q-test; see Materials and methods). Right, the first significant peak in the VR autocorrelation for each recording is plotted to give the mean fictive swim frequency for each fish. The red circles are the mean spike autocorrelation frequency obtained from the three significantly autocorrelated granule cells. (f) An example bout from the cell indicated in e), which was located ipsilateral to the ventral root recording. The smoothed spike rate (red) is in antiphase with the ipsilateral fictive tail contractions (grey). |