
Fig. 2
- ID
- ZDB-FIG-190806-10
- Publication
- Knogler et al., 2019 - Motor context dominates output from Purkinje cell functional regions during reflexive visuomotor behaviours
- Other Figures
- All Figure Page
- Back to All Figure Page
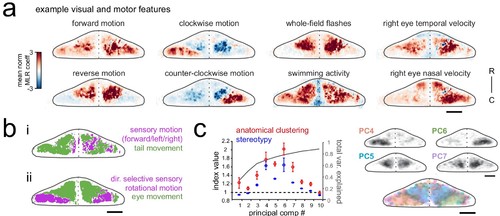
Purkinje cell activity is functionally clustered across the cerebellum.(a) Heatmaps of the z-projected mean voxelwise correlation coefficients from multilinear regression (MLR) with example sensory and motor regressors for a representative fish (see Materials and methods). Scale bar = 50 microns. (b) Voxels from the example fish in a) are colored according to whether the best regressor for correlated sensory stimuli and motor events (including i) swimming and ii) eye movement) are sensory (magenta), motor (green), or equal/uncorrelated (white). (c) Left, quantification of principal component analysis, clustering, and stereotypy of Purkinje cell responses. Left axis, index values across the first ten principal components with respect to the anatomical clustering of principal components within a fish (red line) and the stereotypy of these clusters across fish (blue line). Dotted black line shows an index value of 1 (equivalent to chance). Right axis, total variance explained across principal components. Right panel, mean spatial mapping of the four principal components with the highest index values for anatomical clustering and stereotypy as individual maps (above) and composite (below). Colors are arbitrarily chosen. |