
|
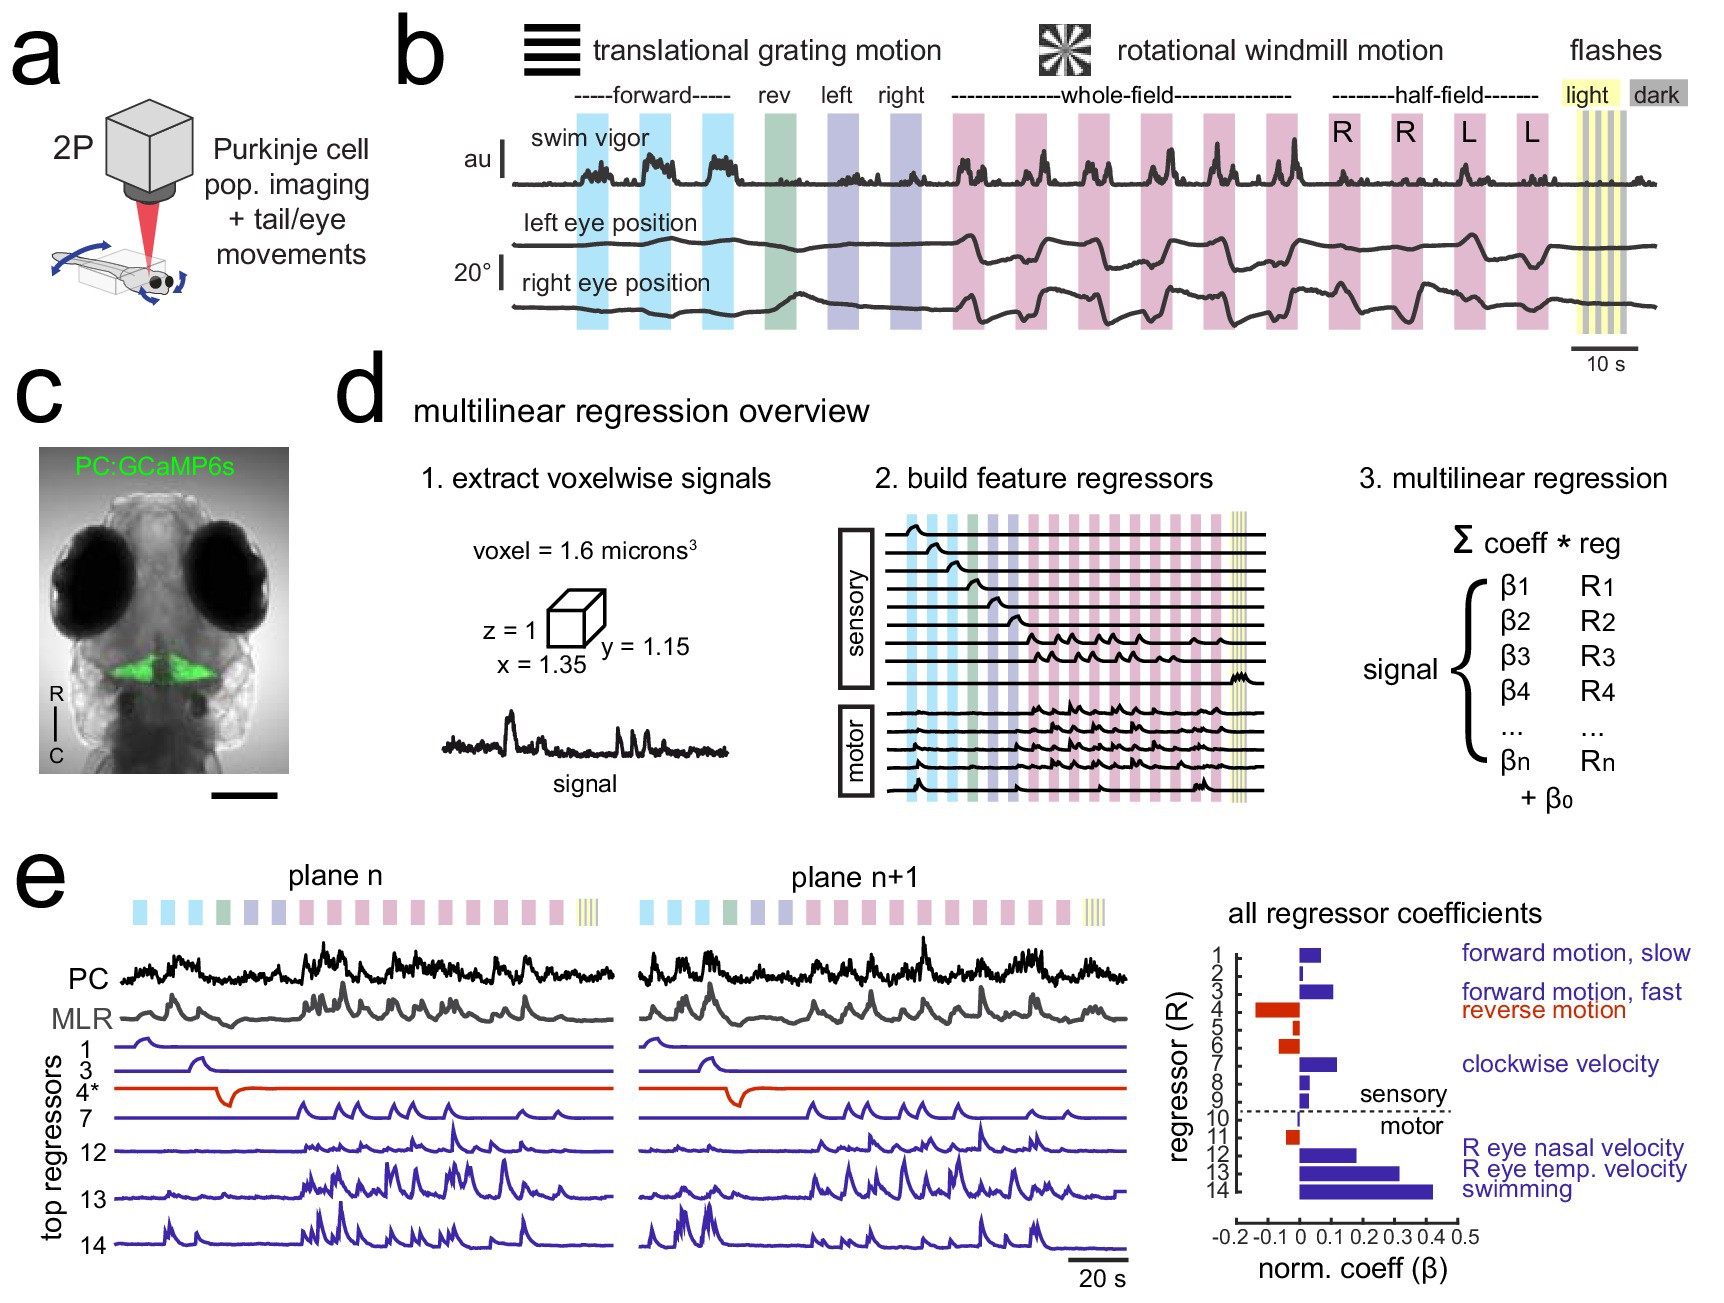
Fig. 1 Using population imaging and multilinear regression to describe feature responses across the Purkinje population during visuomotor behaviors. (a) Cartoon of the embedded zebrafish preparation under the two-photon microscope with freely-moving eyes and tail. (b) Overview of the visual stimuli presented to the awake, behaving zebrafish during volumetric two-photon calcium imaging. See Materials and methods for further details. The mean swimming activity and eye position for a representative fish across an entire experiment is shown (N = 100 trials). (c) Composite bright field image of a seven dpf zebrafish larva from a dorsal view showing Purkinje cells expressing GCaMP6s driven by a ca8 enhancer element. Scale bar = 100 microns. (d) Overview of the multilinear regression analysis. See Materials and methods for additional details and see Figure 1—figure supplement 1 for full list of regressors. (e) Left panels, example calcium signal from a Purkinje cell across two planes (black trace) can be well recapitulated through multilinear regression (MLR, grey trace; R2 = 0.77). The regressors with the seven largest coefficients (β) are shown below scaled in height and colored by their β value (blue = positive, red = negative). The asterisk for regressor four refers to a negative value of β which results in an inverted regressor. Right, a bar graph quantifying the normalized β values for all regressors for this cell with the regressors shown at left labelled. See also Figure 1—figure supplements 1 and 2.