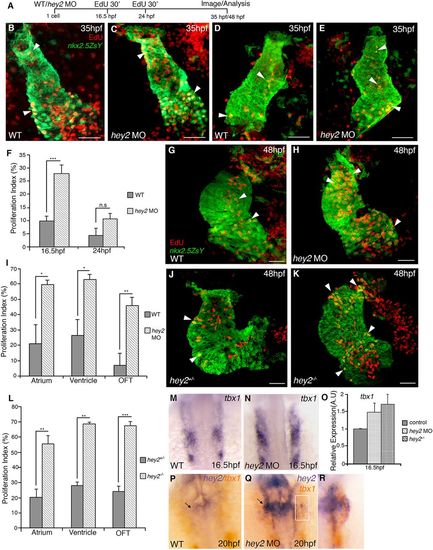
Hey2 inhibits cardiac progenitor cell proliferation during early cardiac development. (A) Schematic of experimental approach for EdU analysis. (B-E) Confocal images of EdU incorporation (red) at 16.5 hpf (B-C) and 24 hpf (D-E) in control (B,D) and hey2 MO (C,E) embryos expressing Tg(nkx2.5:ZsYellow) (green). EdU-positive cardiomyocytes are shown as yellow cells following staining at 35 hpf. (F) Proliferation index at 35 hpf in control and Hey2 morphant embryos following EdU pulse at 16.5 hpf (N=2, n=7) and 24 hpf (N=2, n=4). (G,H) EdU incorporation at 48 hpf in control (G) and hey2 MO (H) embryos following EdU pulse at 16.5 hpf. (I) Proliferation index comparing the number of EdU+ CMs in the atrium, ventricle and OFT between control and hey2 MO embryos at 48 hpf (N=3, n=5). (J,K) EdU incorporation at 48 hpf in hey2 heterozygous (J) and mutant (K) embryos following EdU pulse at 16.5 hpf. (L) Proliferation index comparing the number of EdU+ CMs in the atrium, ventricle and OFT at 48 hpf (N=3, n=14). (M-O) Expression of tbx1 in wild-type (M) and hey2 morphant (N) embryos. Quantitative RT-PCR analysis at 16.5 hpf comparing relative tbx1 expression in control embryos with hey2 morphants and hey2 mutants is shown (O). (P-R) Co-expression of hey2 (blue) and tbx1 (orange) at 20 hpf in control (P) and hey2 morphant (Q, boxed area magnified in R) embryos. Arrowheads highlight EdU+/Nkx2.5+ CMs; arrows indicate hey2+/tbx1+ pharyngeal mesoderm. Scale bars: 20 µm. Data are mean±s.e.m.; *P<0.05; **P>0.01; ***P<0.001. WT, wild type.
|
