
Fig. 5
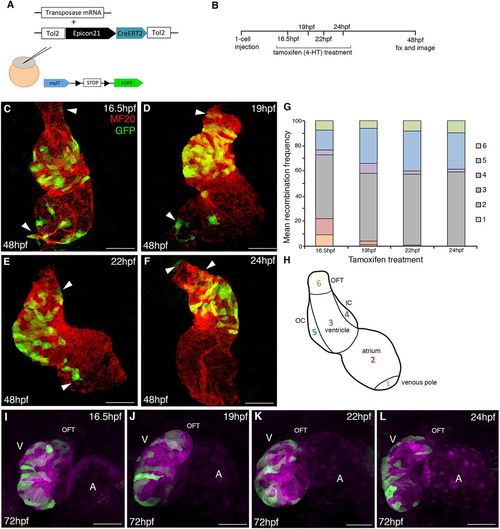
Lineage contribution of hey2+ cells to cardiac development. (A,B) Schematic of the experimental design for lineage tracing of hey2+ cells. (C-F) MF20 and EGFP immunofluorescence staining at 48 hpf showing distribution of Cre-marked cardiomyocytes. Arrowheads indicate labelled cardiomyocytes at the poles of the heart. (G) Bar graph illustrating the contribution of recombined cells to various regions of the heart following 4-HT treatment at 16.5, 19, 22 and 24 hpf (N=3, n=12 at 16.5 hpf; n=6 at 19 hpf; n=16 at 22 hpf; n=14 at 24 hpf). (H) Schematic representation showing the cardiac regions used for recombination analysis. (I-L) Representative images of Tg(epicon21:CreERT2)hsc104×Tg(actb2:RSG) hearts at 72 hpf following 4-HT treatment at 16.5 hpf (I), 19 hpf (J), 22 hpf (K) and 24 hpf (L). Recombined cells are shown in green, with unmarked cells of the heart represented in magenta. A, atrium; V, ventricle; OFT, outflow tract. Scale bars: 50 µm. |
| Genes: | |
|---|---|
| Fish: | |
| Condition: | |
| Anatomical Term: | |
| Stage: | Protruding-mouth |