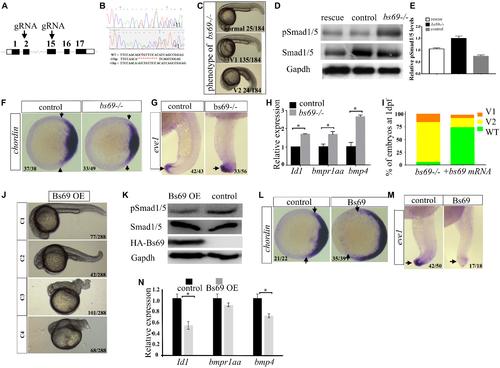
Bs69 negatively regulates Bmp signaling. (A) Schematic representation of bs69 gene, showing the CRISPR/Cas9 targeting site in exon 15. (B) Sequences of the two bs69 mutants at the CRISPR targeting site. CRISPR-induced 11 bp deletion is highlighted in red; CRISPR-induced 1 bp insertion is highlighted in green. (C) The phenotypes of bs69 mutant embryos at 1 dpf. V1: V1 ventralized phenotype; and V2: V2 ventralized phenotype, according to the DV patterning index (Kishimoto et al., 1997). (D) Immunoblot analysis of pSmad1/5 levels in lysates from 8 hpf control, bs69 mutant, and Bs69 restored embryos. (E) Quantification of pSmad1/5 levels from panel D. (F) Chordin expression in bs69 mutant and control embryos at shield stage. Animal view, and dorsal to the right. (G) eve1 expression in bs69 mutant and control embryos at 22 hpf. lateral view, and dorsal to the right. (H) qRT-PCR analysis of the Bmp target genes in 8 hpf bs69 mutant and control embryos. (I) One-cell-stage bs69 mutant embryos were injected with 50 pg bs69 mRNA, and the injected embryo at 30 hpf were scored and phenotyped according to the dorsal-ventral patterning index. (J) The phenotypes of Bs69 overexpressing embryos at 2 dpf. C1-4 dorsalized phenotypes according to DV patterning index. (K) Immunoblot analysis of pSmad1/5 levels of lysates from 8 hpf control and Bs69 overexpressing embryos. (L) Chordin expression in Bs69 overexpressing embryos at shield stage. Animal view, and dorsal to the right. (M) eve1 expression in BS69 overexpressing embryos at 22 hpf. Lateral view, and dorsal to the right. (N) qRT-PCR transcript analysis of the indicated Bmp target genes in 8 hpf control and Bs69 overexpressing embryos. All experiments were performed in technical triplicate and are representative of multiple experiments. ∗p < 0.05.
|
