
Fig. 6
- ID
- ZDB-FIG-181019-38
- Publication
- Yin et al., 2018 - Spatiotemporal Coordination of FGF and Shh Signaling Underlies the Specification of Myoblasts in the Zebrafish Embryo
- Other Figures
- All Figure Page
- Back to All Figure Page
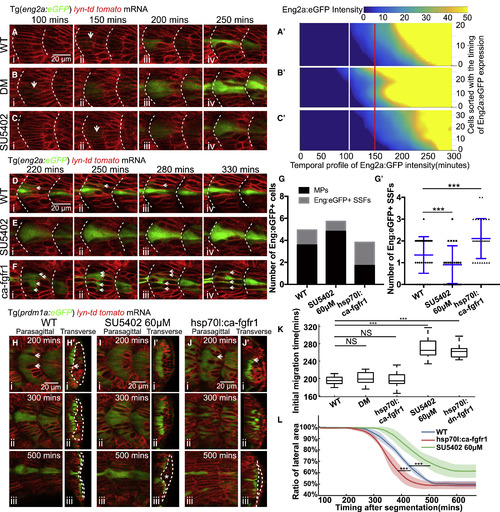
FGF Signaling Determines MP Cell Fate by Regulating Slow Muscle Migration (A–C) Time lapses of Eng2a:eGFP expression during MP differentiation in wild-type embryos (A), embryos under treatment of dorsomorphin (DM) at 50 μM (B), or SU5402 at 60 μM (C). White short arrows denote the onset of Eng2a:eGFP expression that can be identified. (Aʹ–Cʹ) The corresponding temporal expression profile of Eng2a:eGFP for individual MP under same conditions of (A–C). All the MPs in each group are sorted along the y axis according to the timing of initial Eng2a:eGFP expression. The color map represents differential intensity of Eng2a:eGFP for each cell. White and red lines label the start and end of the time window for the onset of Eng2a:eGFP expression. (Aʹ) (nCells = 22 from total of 6 somites taken from 5 embryos); (Bʹ) (nCells = 28 from total of 6 somites taken from 4 embryos); (Cʹ) (nCells = 34 from total of 7 somites taken from 5 embryos). (D–F) Time lapses of Eng2a:eGFP expression in MPs and Eng2a:eGFP+ SSFs in wild-type embryos (D), embryos under treatment of SU5402 at 60 μM (E), and heat shock of hsp70l:ca-fgfr1 (F). White short arrows label Eng2a:eGFP+ SSFs. (G and Gʹ) The number of MPs and Eng2a:eGFP+ SSFs (Gʹ) per muscle segments in conditions of (D)–(F) (nSegments = 31, 22, 28, nEmbryos = 7, 7, 5, ∗∗∗p < 0.001, Student’s t test). (H–J) Time lapses of slow muscle migration in wild-type embryos (H), embryos under treatment of SU5402 at 60 μM (I), or heat shock of hsp70l:ca-fgfr1 (J). Slow muscles are identified by the expression of Prdm1a:GFP. (Hʹ–Jʹ) The reconstructed transverse view of (H)–(J) with medial to the left and dorsal to the top. White arrows denote the breaking of the slow muscle monolayer by fast muscle elongation. Dash lines label the area at the lateral side of slow muscles. White asterisk in (Iʹ iii) denotes the ectopic ECL cells under SU5402 treatment. (K) Timing of the initiation of lateral migration in wild-type embryos (nSomites = 15 from 5 embryos), embryos under dorsomorphin (DM) treatment at 50 μM (nSomites = 12 from 5 embryos), heat shock of hsp70l:ca-fgfr1 (nSomites = 12 from 5 embryos), SU5402 treatment at 60 μM (nSomites = 15 from 5 embryos), and heat shock of hsp70l:dn-fgfr1-eGFP (nSomites = 15 from 5 embryos) (∗∗∗p < 0.001, NSp > 0.05, Student’s t test). (L) The relative size of lateral area (labeled with dash lines in Figures 6H–6J) throughout the lateral migration of SSFs. Blue, green, and red denote the profiles under conditions of (H)–(J) (total of 5 somites from 5 separate embryos in each condition). ∗∗∗p < 0.001, Student’s t test. Images taken at muscle segments 16–18. |
Reprinted from Developmental Cell, 46, Yin, J., Lee, R., Ono, Y., Ingham, P.W., Saunders, T.E., Spatiotemporal Coordination of FGF and Shh Signaling Underlies the Specification of Myoblasts in the Zebrafish Embryo, 735-750.e4, Copyright (2018) with permission from Elsevier. Full text @ Dev. Cell