
Fig. 2
- ID
- ZDB-FIG-181019-34
- Publication
- Yin et al., 2018 - Spatiotemporal Coordination of FGF and Shh Signaling Underlies the Specification of Myoblasts in the Zebrafish Embryo
- Other Figures
- All Figure Page
- Back to All Figure Page
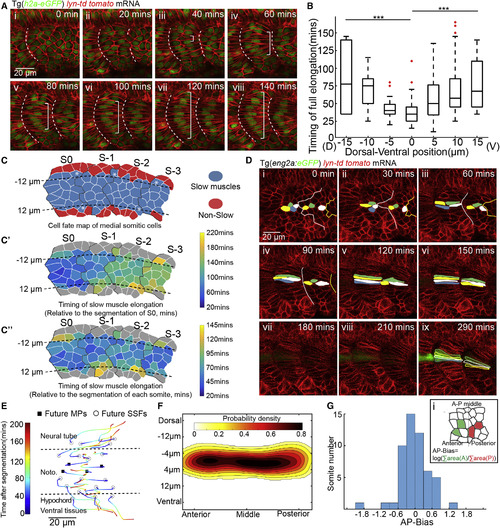
Morphogenesis of Adaxial Cells and the Determination of MPs from DV Midline (A)Time-lapse of the muscle morphogenesis of adaxial cells from segmentation (i) to 140 min after segmentation (viii). Anterior to the left and dorsal to the top in all parasagittal views unless otherwise stated. Timing refers to the relative time after the formation of corresponding somite in all figures unless otherwise stated. White brackets label fully elongated adaxial cells. White dash lines denote somite boundaries unless otherwise stated. Images are taken at somite 18–20. (B) The timing of elongation of each individual adaxial cell at different positions relative to DV midline (nCells = 135, from total of 8 somites taken from 8 embryos, ∗∗∗p < 0.001, Student’s t test). (C–Cʹʹ) Mapping of all slow muscles from four contiguous somites back to the PSM with colors denoting distinct cell fates (C), timing of elongation relative to the segmentation of somite S0 (Cʹ) or relative to the segmentation of each somite (Cʹʹ). Black dash lines label the position of notochord. White asterisks in (C) label the adaxial cells lying on the dorsal or ventral margin of the notochord. (D) Time-lapse of MP differentiation with the live MP cell fate marker eng2a:GFP from PSM (i) to 290 min later (ix). Images are taken at somite 19–20. (E) 2D representation of the adaxial cell rearrangement during slow muscle myogenesis. The varying colors in each track denote the corresponding time relative to the somite segmentation. Black circles and squares denote to the initial positions of future SSFs and MPs, respectively. (F) Probability map of MP initial position constructed from adaxial cell positions in S0 (nSomites = 52, nEmbryos = 16). Left, right, top and bottom refer to anterior, posterior, dorsal and ventral side of adaxial cell population, respectivel. (G) Distribution of AP-Bias of the quantified 52 somite. (i) The AP-Bias in each somite is defined by log(∑area(A)/∑area(P)). ∑area(A) and ∑area(P) denote the area taken by the future MPs anteriorly and posteriorly in the somite, respectively. |
Reprinted from Developmental Cell, 46, Yin, J., Lee, R., Ono, Y., Ingham, P.W., Saunders, T.E., Spatiotemporal Coordination of FGF and Shh Signaling Underlies the Specification of Myoblasts in the Zebrafish Embryo, 735-750.e4, Copyright (2018) with permission from Elsevier. Full text @ Dev. Cell