
Fig. 2
- ID
- ZDB-FIG-180918-23
- Publication
- Xing et al., 2018 - Mutational analysis of dishevelled genes in zebrafish reveals distinct functions in embryonic patterning and gastrulation cell movements
- Other Figures
- All Figure Page
- Back to All Figure Page
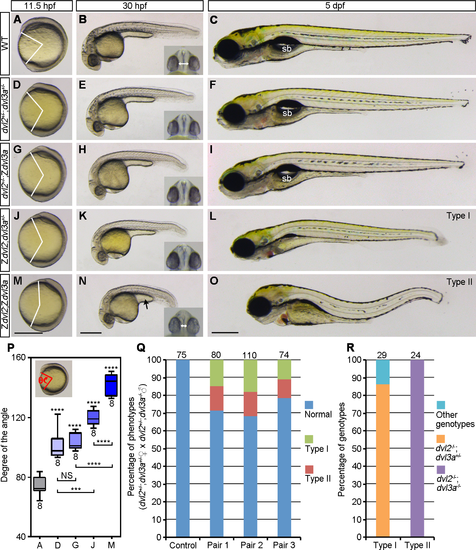
Zygotic Dvl2 and Dvl3a in axis extension. Mutant phenotypes were compared with WT embryos at indicated stages. Insets show eye phenotypes in ventral view, with bidirectional arrows indicating the distance of the two eyes. (A-C) WT embryos. (D-F) Double heterozygous dvl2+/-;dvl3a+/- mutants, from crosses between female dvl2-/- fish and male dvl3a-/- fish, show weakly delayed axis extension at 11.5 hpf, but are phenotypically normal at later stages. (G-I) Triallelic dvl2+/-;Zdvl3a mutants,from crosses between dvl2+/-;dvl3a+/- carriers, display weak axis extension defect at 11.5 hpf and 30 hpf, and recover at 5 dpf. (J-L) Triallelic Zdvl2;dvl3a+/- mutants, from crosses between dvl2+/-;dvl3a+/- carriers, exhibit more obvious axis extension defect at 11.5 hpf and 30 hpf, and develop shortened AP axis, compressed head, and reduced swim bladder at 5 dpf, which are referred as type I phenotype. (M-O) Zdvl2;Zdvl3a mutants, from crosses between female dvl2+/-;dvl3a+/- fish and male dvl2+/-;Zdvl3a fish, show more strong axis extension defect at 11.5 hpf and 30 hpf, and present a severe type II phenotype, with shortened and wavy axis, craniofacial defects, and complete disappearance of swim bladder (sb) at 5 dpf. (P) Statistical analysis of the extent of axis extension delay, after genotyping of imaged embryos at 11.5 hpf. Capital letters of the abscissa correspond to the images at 11.5 hpf. Bars represent the mean ± s.d. from indicated numbers of embryos, and asterisks above the bars refer to comparison with WT embryos (***, P<0.001; ****, P<0.0001; NS, not significant). (Q) Quantitative analysis of type I and type II phenotypes at 5 dpf from three independent female dvl2+/-;dvl3a+/- and male dvl2+/-;dvl3a-/- fish pairs. Control embryos were from crosses between female WT fish and male dvl2+/-;dvl3a-/- fish. (R) Genotypes of type I and type II embryos. Numbers on the top of each column indicate total embryos analyzed. Scale bars: (A, D, G, J, M) 400 μm; (B, E, H, K, N) 400 μm; (C, F, I, L, O) 400 μm. |
| Fish: | |
|---|---|
| Observed In: | |
| Stage Range: | 1-4 somites to Day 5 |