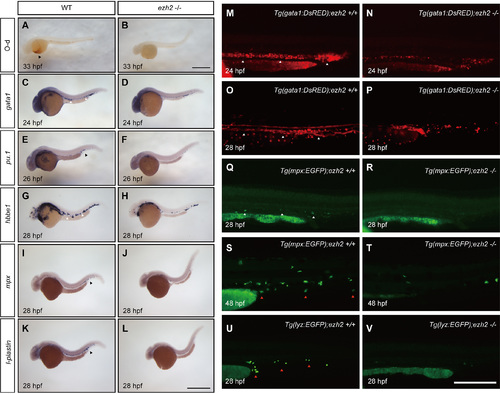
Primitive hematopoiesis is disrupted in ezh2–/– mutant zebrafish. (A, B) O-dianisidine (O-d) staining of wild-type sibling (A) and ezh2–/– mutant fish (B) at 33 hpf. Black arrowhead indicates hemoglobin-staining, which is significantly reduced in ezh2–/– mutant zebrafish. (C–L) In situ hybridization of wild-type (C, E, G, I and K) and ezh2–/– mutant embryos (D, F, H, J and L) using probes of gata1 (C, D), pu.1 (E, F), hbbe1 (G, H), mpx (I, J), l-plastin (K, L) at 26 hpf (C-F) and 28 hpf (G-L), respectively. White arrowheads in (C) and (G) indicate ICM (Intermediate cell mass) and black arrowheads in (E, I and K) PBI (Posterior blood island). Scale bar, 0.25 mm. (M–P) Images of gata1:dsRed cells in WT (M, O) and ezh2–/– mutant (N, P) fish at 24 hpf (M, N) and 28 hpf (O, P). (Q–T) Images of mpx:eGFP cells in wild-type (Q, S) and ezh2–/– mutant (R, T) fish at 28 hpf (Q, R) and 48 hpf (S, T). (U, V) Images of lyz:eGFP cells in wild-type (U) and ezh2–/– mutant (V) fish at 28 hpf. White arrowheads in (M–R) indicate ICM and red arrowheads in (S–V) PBI. Scale bar in (M–V), 0.25 mm. All images shown are lateral view, anterior to left.
|
