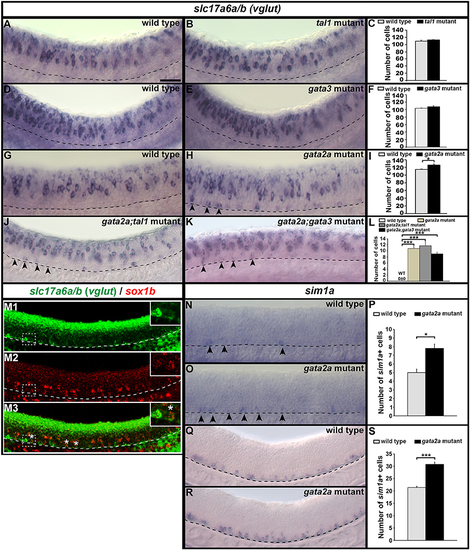
Expression of slc17a6a/b and sim1a in mutant embryos. Lateral views of slc17a6a/b (vglut) (A,B,D,E,G,H,J,K), slc17a6a/b (green) and sox1b (red) (M), and sim1a (N,O,Q,R) expression in WT sibling and mutant embryos as indicated. Dorsal, top; anterior, left. All embryos are 24 h except (M,Q,R), which are 32 h. Arrowheads indicate glutamatergic cells (H,J,K) or sim1a-expressing cells (N,O) in the KA″ region. Scale bar = 50 microns. Dashed lines indicate ventral limit of spinal cord. White boxes in (M) are single confocal magnified views of dotted white box. White stars indicate double-labeled cells. Mean number of cells expressing these genes in spinal cord region adjacent to somites 6–10 in WT and mutant embryos (C,F,I,L,P,S). Panels (C,F,I,P,S) show counts for all dorsal-ventral rows. Panel (L) shows counts for just row 1 and hence, the value for WT embryos is zero. All counts are an average of at least 4 embryos. Error bars indicate SEM. Statistically significant comparisons are indicated with brackets and stars. ***P < 0.001, *P < 0.05. For P-values see Supplementary Table 6.
|
