
Fig. S8
- ID
- ZDB-FIG-180705-67
- Publication
- Williams et al., 2018 - Gon4l regulates notochord boundary formation and cell polarity underlying axis extension by repressing adhesion genes
- Other Figures
- All Figure Page
- Back to All Figure Page
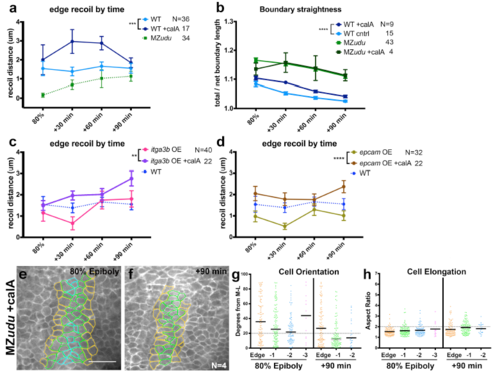
Calyculin A treatment increases notochord boundary tension without improving MZudu-/- boundary straightness or cell polarity a) Quantification of cell vertex recoil distance upon laser ablation of Edge cell interfaces at the time points indicated in MZudu-/-, WT, and Calyculin A-treated WT gastrulae. Symbols are means with SEM (2-way ANOVA, ***p=0.0006). b) Quantification of boundary straightness in WT and MZudu-/- gastrulae with or without Calyculin A treatment. Symbols are means with SEM (2-way ANOVA, ****p<0.0001). c-d) Cell vertex recoil distance upon laser ablation of Edge cell interfaces at the time points indicated in WT embryos overexpressing itga3b (c) or epcam (d) with or without Calyculin A treatment. Symbols are means with SEM (2- way ANOVA, **p=0.027, ****p<0.0001). e-h) Quantification of axial mesoderm cell orientation (g) and elongation (h) in Calyculin A-treated MZudu-/- gastrulae. Graphs and color coding as in Fig.3. Bars are median values in g and mean values in h. Scale bar is 50μm. N indicates the number of embryos analyzed. |