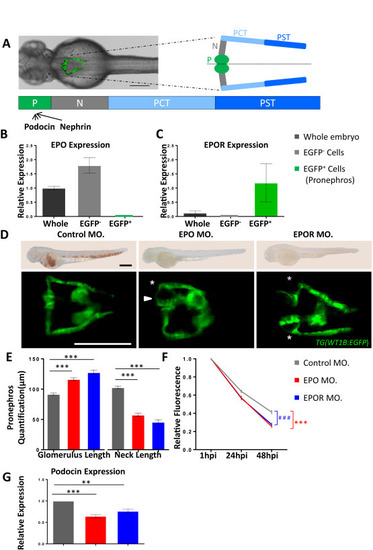
Genetic inactivation of EPO signaling induced pronephros structure alteration and proteinuria in zebrafish. A. Left: zebrafish embryo, shown in a dorsal view, with pronephros depicted in green fluorescence. Right: pronephros drawing showed segmental organization (P = podoycytes/glomerulus; N = neck; PCT = Proximal convoluted tubule; PST = Proximal straight tubule). Below: expression of indicated genes, podocin and nephrin, related to split diagram formation in zebrafish. B, C. Relative expression of EPO and EPOR at 48 hpf analyzed by RT-PCR from RNA isolated from whole zebrafish embryos, EGFP negative (EGFP−) cell fraction (entire embryo excluding pronephros), and pronephros (EGFP+) cell fraction. While EPO was mostly expressed in EGFP− cell traction, EPOR was preferentially expressed in pronephros (EGFP+). D. As compared to control morphants (Control MO.), EPO morphants (EPO MO.) and EPOR morphants (EPOR MO.) showed an enlarged glomerulus (white arrow head) and a highly shortened pronephric neck (white asterisks). The fluorescence microscopy images were taken at 48 hpf of TG(WT1B:EGFP) zebrafish embryos. White scale bar: 200 μm. The light microscopy images above showed a large percentage or nearly completely loss of hemoglobin, i.e. almost absence of red blood cells in EPO MO. and EPOR MO. at 48 hpf, indicating functionality of EPO and EPOR mopholinos. In contrast, Control MO. injected embryos had a high abundance of red blood cells. Black scale bar in O-dianiside stain: 500 μm. E. Altered pronephros structure in EPO morphants and EPOR morphants as indicated by length of the neck and length of glomerulus was quantified in three independent experiments. (n = 56–78 embryos per group). F. Increased loss of intracardiac injected 70 kDa dextran–FITC at 24 hpi and 48 hpi in EPO morphants and EPOR morphants as compared to control morphants showing three independent experiments. (n = 41–50 embryos per group). G. Relative expression of Podocin at 48 hpf analyzed by RT-PCR from RNA isolated from EPO MO., EPOR MO., and Control MO. H. Relative expression of Nephrin at 48 hpf analyzed by RT-PCR from RNA isolated from EPO MO., EPOR MO., and Control MO. Data were analyzed using the Student‘s t-test (E and F) or Mann–Whitney-U-test (G and H). Mean ± s.e.m. ns. Not significant. **p < 0.01, *** or ###p < 0.001.
|
