
Fig. 6
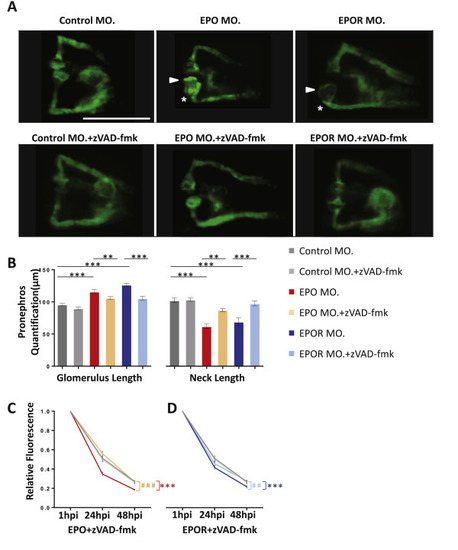
Apoptosis inhibition treatment partially rescued pronephros phenotype induced by EPO inactivation. A. Normalization of enlarged glomerulus (white arrow head) and shortened pronephric neck (white asterisks) in EPO MO. and EPOR MO. zebrafish embryos treated at 24 hpf with zVAD-fmk (300 μM) for 24 h. White scale bar: 200 μm. B. Quantification of data shown in Figure A performed in three independent experiments. (n = 40–52 embryos per group). **p ≤ 0.01 or ***p < 0.001 as indicated. C. Elevated loss of 70 kDa dextran–FITC fluorescence at 24 hpi and 48 hpi in EPO MO. zebrafish embryos was rescued by zVAD-fmk treatment (n = 41–43 embryos per group). Significance was given for EPO MO. against Control MO. as ***p < 0.001, and EPO MO. + zVAD-fmk against EPO MO. as ###p < 0.001. D. Elevated loss of 70 kDa dextran–FITC fluorescence at 24 hpi and 48 hpi in EPOR MO. zebrafish embryos was rescued by zVAD-fmk incubation (n = 41–47 embryos per group). Same Control MO. and Control MO. + zVAD-fmk were applied. Significance was given for EPOR MO. against Control MO. as ***p < 0.001, and EPOR MO. + zVAD-fmk against EPOR MO. as ##p < 0.01 as indicated. All data were analyzed using the Student‘s t-test. Mean ± s.e.m. |
| Fish: | |
|---|---|
| Condition: | |
| Knockdown Reagents: | |
| Observed In: | |
| Stage Range: | Long-pec to Day 5 |