
Fig. 7
- ID
- ZDB-FIG-180608-33
- Publication
- van Leeuwen et al., 2018 - A transgenic zebrafish model for the in vivo study of the blood and choroid plexus brain barriers using claudin 5.
- Other Figures
- All Figure Page
- Back to All Figure Page
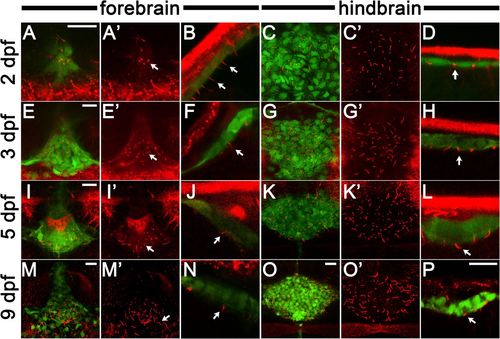
cldn5a:EGFP-labelled cells in the CP are ciliated throughout development. Images of cilia visualized by staining with anti-glutamylated tubulin antibody (red) and cldn5a:EGFP-positive cells (green). (A,E,I,M) Confocal images of the dorsal view of the dCP in 2, 3, 5, 9 dpf as indicated. (B,F,J,N) Side views of the dCP at the same stages. Cilia project from GFP-positive cells. (C,G,K,O) Dorsal views of the mCP at 2, 3, 5, 9 dpf, respectively. (D,H,L,P) Side views of the mCP. Cilia projected from the GFP-labelled mCP cells. For A,C,E,G,I,K,M,O, the red channel is shown separately to the right. Arrows indicate cilia. In dorsal view panels, anterior is down. In all side view panels, dorsal is up. Scale bars: 15 µm. Scale bar in P applies to all side view images (B,D,F,H,J,L,N,P). Scale bar in O applies to all dorsal views of the mCP (C,G,K,O). |
| Gene: | |
|---|---|
| Fish: | |
| Anatomical Terms: | |
| Stage Range: | Long-pec to Days 7-13 |