
Fig. 5
- ID
- ZDB-FIG-180608-31
- Publication
- van Leeuwen et al., 2018 - A transgenic zebrafish model for the in vivo study of the blood and choroid plexus brain barriers using claudin 5.
- Other Figures
- All Figure Page
- Back to All Figure Page
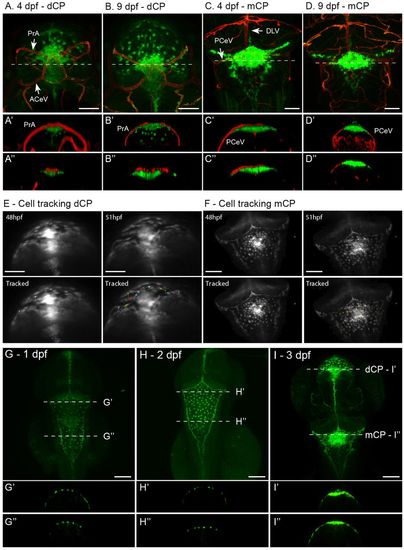
Blood-CP barrier. (A) Dorsal view of dCP of Tg(kdrl:mCherry)is5;TgBAC(cldn5a:EGFP)vum2 larva at 4 dpf, showing the close correlation between the vasculature (red) and claudin 5a-expressing cells (green). The ACeV and PrA form a vascular circuit surrounding the dCP. Transversal view with 3D model (A′) and single Z-slice at the dotted line in A (A″) visualize the close correlation between these structures. (B) Dorsal view of dCP in a larva at 9 dpf, with transversal view in a 3D model (B′) and single Z-slice at dotted line (B″). (C) At 9 dpf, the blood-dCP barrier is formed by the PrA. At the level of the mCP, the PCeV and DLV form a vascular circuit. Transversal view in C′ with a 3D model and C″ with a single Z-slice at the level of the dotted line in C show the close correlation between the mCP and vasculature. (D) Dorsal view of mCP in a larva at 9 dpf, with transversal view in a 3D model (D′) and single Z-slice at dotted line (D″). ACeV, anterior cerebral vein; DLV, dorsal longitudinal vein; PCeV, posterior cerebral vein; PrA, prosencephalic artery. (E) First and last images of time lapse of dCP cell migration at 48-51 dpf. Time lapse is presented in Movie 3. (F) First and last images of time lapse of mCP cell migration at 48-51 dpf. Time lapse is presented in Movie 4. (G-I) Dorsal view of head of TgBAC(cldn5a:EGFP)vum2 larvae between 1 dpf and 3 dpf, the timeframe in which the major morphological transformation is observed. Transversal section is shown for every time point in G′,H′,I′ and G″,H″,I″, corresponding to the dotted lines depicted in G-I. This visualizes the superficial localisation of the GFP-expressing cells of the mCP and dCP. Scale bars: 50 μm in A-F; 100 μm in G-I. |
| Genes: | |
|---|---|
| Fish: | |
| Anatomical Terms: | |
| Stage Range: | Prim-5 to Days 7-13 |