
Fig. 2
- ID
- ZDB-FIG-180608-28
- Publication
- van Leeuwen et al., 2018 - A transgenic zebrafish model for the in vivo study of the blood and choroid plexus brain barriers using claudin 5.
- Other Figures
- All Figure Page
- Back to All Figure Page
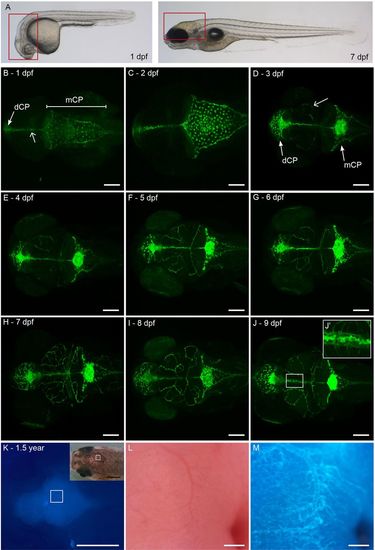
Developmental expression of claudin 5a. (A) Lateral view of a Casper zebrafish larva at 1 dpf and 7 dpf. Boxed areas represent the brain regions of which confocal images are shown in B-J. (B-J) Z-stacks of dorsal view of larval head to visualize development of GFP expression from 1 to 9 dpf. GFP expression can be found in the dCP and mCP from 1 dpf onwards (B, closed arrow). In addition, labelling is observed in the midline connecting the dCP and mCP (B, open arrow, J’). From 3 dpf onwards, labelling in brain parenchyma is observed (D, open arrow). (K) Diffuse GFP expression in brain region of adult zebrafish, 1.5 years, with corresponding brightfield image. The boxed area in K and its inset is enlarged in M and L, respectively. (L) Brightfield image of blood vessel in adult brain, colocalizing with (M) Claudin 5a:GFP expression. Scale bars: 100 μm in B-J; 1 mm in K; 200 μm in L,M. |
| Gene: | |
|---|---|
| Fish: | |
| Anatomical Terms: | |
| Stage Range: | Prim-5 to Adult |