
- Title
-
A transgenic zebrafish model for the in vivo study of the blood and choroid plexus brain barriers using claudin 5.
- Authors
- van Leeuwen, L.M., Evans, R.J., Jim, K.K., Verboom, T., Fang, X., Bojarczuk, A., Malicki, J., Johnston, S.A., van der Sar, A.M.
- Source
- Full text @ Biol. Open
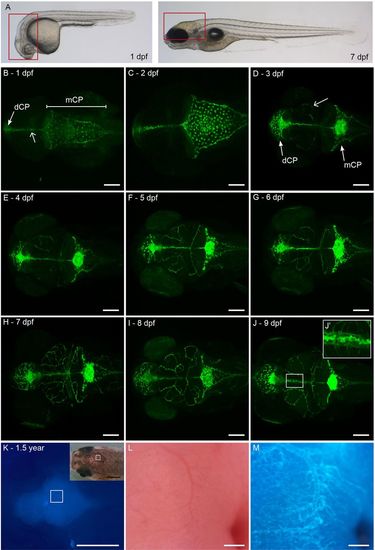
Developmental expression of claudin 5a. (A) Lateral view of a Casper zebrafish larva at 1 dpf and 7 dpf. Boxed areas represent the brain regions of which confocal images are shown in B-J. (B-J) Z-stacks of dorsal view of larval head to visualize development of GFP expression from 1 to 9 dpf. GFP expression can be found in the dCP and mCP from 1 dpf onwards (B, closed arrow). In addition, labelling is observed in the midline connecting the dCP and mCP (B, open arrow, J’). From 3 dpf onwards, labelling in brain parenchyma is observed (D, open arrow). (K) Diffuse GFP expression in brain region of adult zebrafish, 1.5 years, with corresponding brightfield image. The boxed area in K and its inset is enlarged in M and L, respectively. (L) Brightfield image of blood vessel in adult brain, colocalizing with (M) Claudin 5a:GFP expression. Scale bars: 100 μm in B-J; 1 mm in K; 200 μm in L,M. |
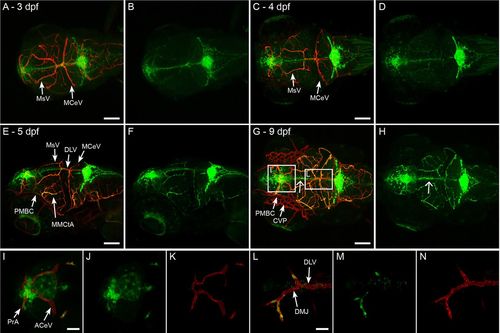
Development of Claudin 5a expression in brain vasculature. (A,B) Dorsal view of head of Tg(kdrl:mCherry)is5;TgBAC(cldn5a:EGFP)vum2 larva at 3 dpf. Merge of both channels is shown in A, single green fluorescent expression is shown in B. Claudin 5a is first expressed in the mesencephalic vein (MsV) and middle cerebral vein (MCeV). (C-F) Expansion of claudin 5a expression over time, with almost all blood vessels expressing claudin 5a at 5 dpf (E-F): dorsal view (C,D), dorsal/lateral view (E,F). (G,H) Dorsal view of head of Tg(kdrl:mCherry)is5;TgBAC(cldn5a:EGFP)vum2 larva at 9 dpf. The boxed areas are shown enlarged in I-K and L-N. Open arrow shows the strong expression of claudin 5a in the midline in the absence of a colocalizing blood vessel (H). Specific spots that never express claudin 5a are the primordial midbrain channels (PMBC) and choroidal vascular plexus (CVP) (G), anterior cerebral vein (ACeV) (I), and dorsal midline junction (DMJ) and dorsal longitudinal vein (DLV) (L). Scale bars: 100 μm in A,C,E,G; 25 μm in I,L. EXPRESSION / LABELING:
|
Development of Claudin 5a expression in brain vasculature. (A,B) Dorsal view of head of Tg(kdrl:mCherry)is5;TgBAC(cldn5a:EGFP)vum2 larva at 3 dpf. Merge of both channels is shown in A, single green fluorescent expression is shown in B. Claudin 5a is first expressed in the mesencephalic vein (MsV) and middle cerebral vein (MCeV). (C-F) Expansion of claudin 5a expression over time, with almost all blood vessels expressing claudin 5a at 5 dpf (E-F): dorsal view (C,D), dorsal/lateral view (E,F). (G,H) Dorsal view of head of Tg(kdrl:mCherry)is5;TgBAC(cldn5a:EGFP)vum2 larva at 9 dpf. The boxed areas are shown enlarged in I-K and L-N. Open arrow shows the strong expression of claudin 5a in the midline in the absence of a colocalizing blood vessel (H). Specific spots that never express claudin 5a are the primordial midbrain channels (PMBC) and choroidal vascular plexus (CVP) (G), anterior cerebral vein (ACeV) (I), and dorsal midline junction (DMJ) and dorsal longitudinal vein (DLV) (L). Scale bars: 100 μm in A,C,E,G; 25 μm in I,L. |
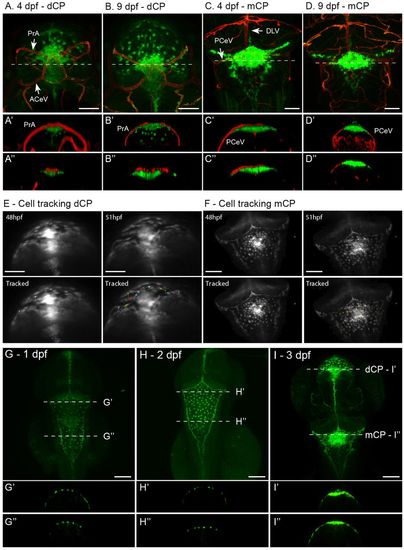
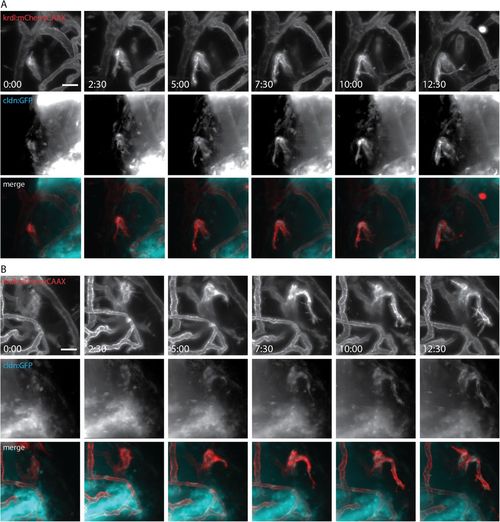
Blood-CP barrier. (A) Dorsal view of dCP of Tg(kdrl:mCherry)is5;TgBAC(cldn5a:EGFP)vum2 larva at 4 dpf, showing the close correlation between the vasculature (red) and claudin 5a-expressing cells (green). The ACeV and PrA form a vascular circuit surrounding the dCP. Transversal view with 3D model (A′) and single Z-slice at the dotted line in A (A″) visualize the close correlation between these structures. (B) Dorsal view of dCP in a larva at 9 dpf, with transversal view in a 3D model (B′) and single Z-slice at dotted line (B″). (C) At 9 dpf, the blood-dCP barrier is formed by the PrA. At the level of the mCP, the PCeV and DLV form a vascular circuit. Transversal view in C′ with a 3D model and C″ with a single Z-slice at the level of the dotted line in C show the close correlation between the mCP and vasculature. (D) Dorsal view of mCP in a larva at 9 dpf, with transversal view in a 3D model (D′) and single Z-slice at dotted line (D″). ACeV, anterior cerebral vein; DLV, dorsal longitudinal vein; PCeV, posterior cerebral vein; PrA, prosencephalic artery. (E) First and last images of time lapse of dCP cell migration at 48-51 dpf. Time lapse is presented in Movie 3. (F) First and last images of time lapse of mCP cell migration at 48-51 dpf. Time lapse is presented in Movie 4. (G-I) Dorsal view of head of TgBAC(cldn5a:EGFP)vum2 larvae between 1 dpf and 3 dpf, the timeframe in which the major morphological transformation is observed. Transversal section is shown for every time point in G′,H′,I′ and G″,H″,I″, corresponding to the dotted lines depicted in G-I. This visualizes the superficial localisation of the GFP-expressing cells of the mCP and dCP. Scale bars: 50 μm in A-F; 100 μm in G-I. |
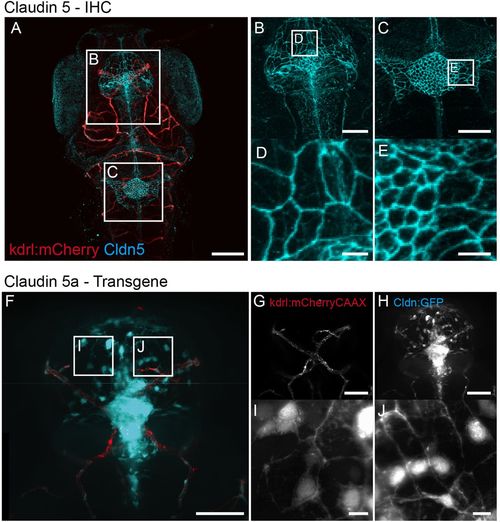
CP morphology. (A) Dorsal view of the head of a 7 dpf Tg(kdrl:mCherry)is5 larva showing blood vessels (red) and immunohistochemistry (IHC) labelling of Claudin 5 (cyan). Boxed areas are shown enlarged in B,D and C,E, and show detailed analysis of the collection of cells that forms the dCP (B) and mCP (C) and is closely connected by Claudin 5. The sheet of cells found in the dCP and mCP of a 7 dpf TgBAC(cldn5a:EGFP)vum2 larva is similar to the phenotype in A-E, although subcellular localizations are not the same. (F) Z-stack of mCP of a Tg(kdrl:mCherry)is5;TgBAC(cldn5a:EGFP)vum2 larva with red fluorescent blood vessels (G) and cyan fluorescent claudin 5a (H). Boxed areas are shown enlarged in I and J, showing high magnification of the network formed by claudin 5a-expressing cells forming the mCP. Scale bars: 100 μm in A; 50 μm in B,C; 10 μm in D,E; 50 μm in F-H; 10 μm in I,J. EXPRESSION / LABELING:
|
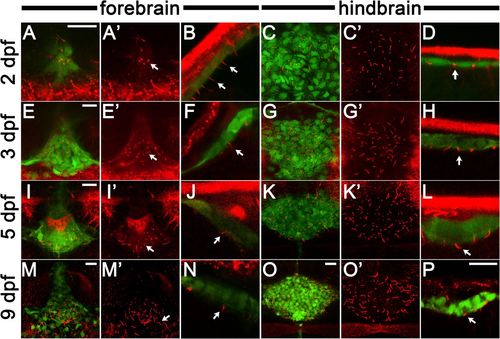
cldn5a:EGFP-labelled cells in the CP are ciliated throughout development. Images of cilia visualized by staining with anti-glutamylated tubulin antibody (red) and cldn5a:EGFP-positive cells (green). (A,E,I,M) Confocal images of the dorsal view of the dCP in 2, 3, 5, 9 dpf as indicated. (B,F,J,N) Side views of the dCP at the same stages. Cilia project from GFP-positive cells. (C,G,K,O) Dorsal views of the mCP at 2, 3, 5, 9 dpf, respectively. (D,H,L,P) Side views of the mCP. Cilia projected from the GFP-labelled mCP cells. For A,C,E,G,I,K,M,O, the red channel is shown separately to the right. Arrows indicate cilia. In dorsal view panels, anterior is down. In all side view panels, dorsal is up. Scale bars: 15 µm. Scale bar in P applies to all side view images (B,D,F,H,J,L,N,P). Scale bar in O applies to all dorsal views of the mCP (C,G,K,O). |
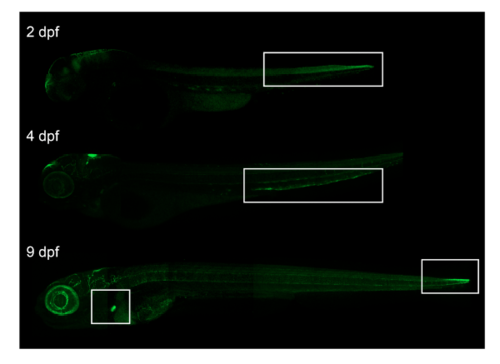
Extra‐neuronal regions with transient expression of Claudin5 Sagittal images of Tg(cldn5a:GFP) larvae at different time points showing transient expression at other locations than the central nervous system. Expression was observed in the caudal hematopoietic tissue (CHT) between 2‐4 dpf, in the tip of the tail and in the heart region at 9 dpf. |