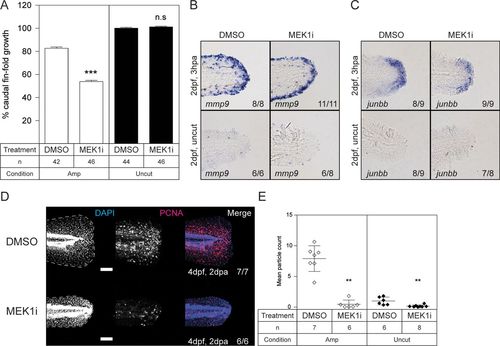
Impaired caudal fin fold regeneration in wild-type zebrafish embryos treated with MEK1 inhibitor. At 2 dpf, the caudal fin folds of wild-type embryos were amputated and allowed to regenerate in the presence of 50 nM PD184352 (MEK1i) or 1% DMSO (solvent control). (A) Regeneration after 3 days was quantified by measuring the distance from the tip of the notochord to the edge of the caudal fin fold. By 3 dpa, regeneration of the caudal fin fold of control zebrafish embryos was 80% complete. The means of caudal fin fold growth are depicted relative to caudal fin fold growth of DMSO-treated uncut controls. The statistical significance of the mean of PD184352 (MEK1i)-treated amputated embryos was determined relative to the mean of DMSO-treated amputated embryos, and likewise for the uncut treated and untreated embryos. The number of embryos is indicated (n). ***, P < 0.001; n.s. not significant; the error bars indicate standard errors of the mean. (B and C) Embryos were fixed at 3 hpa, or the equivalent for uncut controls, and subjected to hybridization for mmp9 (B) or junbb (C). Representative images of caudal fin folds of embryos are shown, and the number of embryos showing similar patterns/total number of embryos analyzed are indicated in the bottom right corner of each image. (D) Embryos were fixed at 2 dpa (4 dpf, 2 dpa) and subjected to whole-mount immunohistochemistry using an antibody specific for the cell proliferation marker PCNA (red). The embryos were counterstained with DAPI (blue). Maximum-intensity projection images were taken of the caudal fin folds. Representative images of amputated embryo caudal fin folds are shown, with the edges of the fin folds indicated with dashed lines. The number of embryos showing similar patterns/total number of embryos analyzed are indicated in the right-hand column. Scale bars, 100 μm. (E) PCNA immunofluorescence between the tip of the notochord and edge of the caudal fin fold was quantified by mean particle count, with thresholding and size restriction to remove background signal. Equivalent uncut controls were also quantified. The means of the amputated PD184352 (MEK1i)-treated group were compared to those of the amputated DMSO-treated group, and likewise, the means of the uncut PD184352 (MEK1i)-treated group were compared to those of the uncut DMSO-treated group. **, P < 0.01; the error bars represent standard deviations.
|
