
Fig. 2
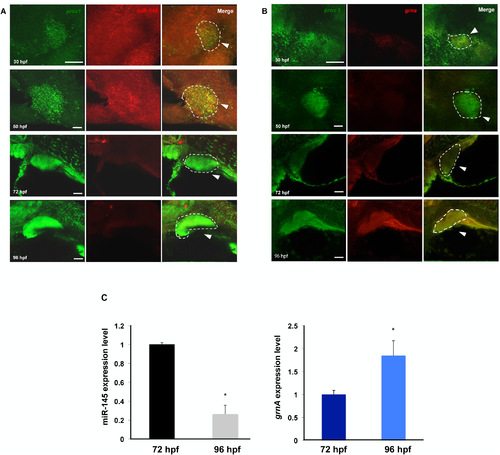
miR-145 and GrnA expression patterns are inversely correlated during liver development. (A,B) The expression patterns of miR-145 (A), grnA (B) and the hepatoblast-specific marker gene prox1 at 30, 50, 72 and 96 hpf were examined using FISH in wild-type zebrafish embryos. Scale bars, 25 μm (at 30 and 50 hpf), 50 μm (at 72 and 96 hpf). The dotted circles indicate prox1 positive cells that represent liver. Ten embryos per experimental group were used and three independent replicates were performed. (C) The fetal liver at 72 and 96 hpf were isolated to quantify liver specific expression patterns of miR-145 and GrnA. Fifteen fetal livers per experiment were used and three independent replicates were performed. The relative expression is normalized with internal control, U6 and ef1a expression. |
| Genes: | |
|---|---|
| Fish: | |
| Anatomical Terms: | |
| Stage Range: | Prim-15 to Day 4 |