
Fig. S3
- ID
- ZDB-FIG-171004-26
- Publication
- Yao et al., 2017 - Screening in larval zebrafish reveals tissue-specific distributions of fifteen fluorescent compounds
- Other Figures
- All Figure Page
- Back to All Figure Page
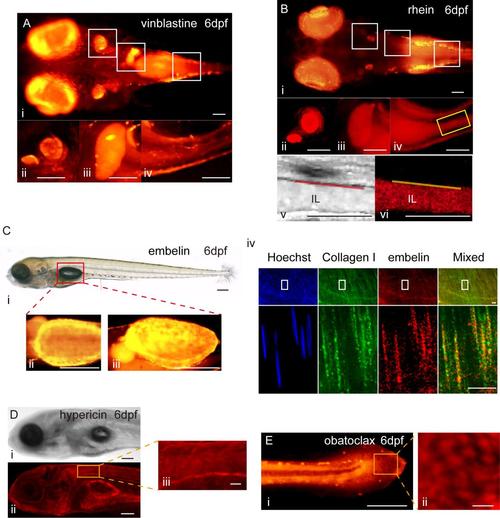
High magnification images of vinblastine-, rhein-, embelin-, hypericin-, and obatoclax-treated zebrafish larvae. A. High magnification images of vinblastine-treated zebrafish larvae. i:Top view of vinblastine-treated zebrafish larvae at 6dpf. ii-iv:The otolith, gall bladder and intestine of vinblastine-treated zebrafish larvae at 6dpf. Scale bar:50μm. B. High magnification imagesof rhein-treated zebrafish larvae. i:Top view of rhein-treated zebrafish larvae at 6dpf. ii-iv:The otolith, gall bladder and intestine of rhein-treated zebrafish larvae at 6dpf. v-vi: the brightfield and fluorescent images about the rheinin the intestine. IL: intestinal lumen. Scale bar: 50μm. C. Distribution of embelinin larval and adult swim bladders. i: brightfield image of embelin-treated zebrafish larvae with the swim bladderat6dpf. ii-iii: the ventral and lateral fluorescent views of swim bladder from embelin-treated zebrafish larvae at 6dpf. Scale bar:100μm.iv: co-staining of embelin and collagen I immunofluorescence in the adult swim bladder. Scale bar: 10μm. D. A single confocal slice of hypericin-treated larvae from the lateral view. i-ii: Scale bar:100μm.iii: Scale bar: 20μm. E. High magnification image of the tail of obatoclax-treated larvae from the lateral view. i: Scale bar:100μm.ii: Scale bar: 10μm. |