
Fig. 4
- ID
- ZDB-FIG-171004-23
- Publication
- Yao et al., 2017 - Screening in larval zebrafish reveals tissue-specific distributions of fifteen fluorescent compounds
- Other Figures
- All Figure Page
- Back to All Figure Page
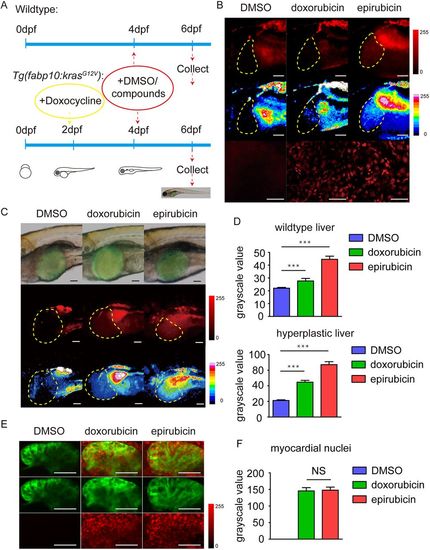
Distributions of epirubicin and doxorubicin in zebrafish livers and hearts. (A) The procedures for adding compounds and chemical inducers in wild-type and transgenic zebrafish larvae. (B) Doxorubicin and epirubicin in wild-type zebrafish liver. The top-row panels are the original images taken using the microscope under the red fluorescence channel. The middle-row panels are the images taken with 16 pseudocolours applied to distinguish different densities of the compounds. The bottom-row panels are the confocal images taken to show the nuclear distributions of the compounds in the liver. Scale bars: 50 μm. (C) Doxorubicin and epirubicin in the tumourigenic zebrafish liver with krasG12V over-expression. The top-row panels are the merged images of the bright-field and green fluorescent channel. The middle-row panels are the original images of the red fluorescent channel. The bottom-row panels are the images with 16 pseudocolours applied to distinguish different densities of the compounds. Scale bars: 50 μm. (D) Statistics of the fluorescence intensity values of wild-type and hyperplastic livers from DMSO-, doxorubicin- and epirubicin-treated zebrafish larvae (n=16). The values are means±s.e.m., with statistical differences being determined by one-way ANOVA, ***P<0.001. (E) Doxorubicin and epirubicin in wild-type zebrafish hearts. The green channel displayed the images of Tg(myl7:EGFP) zebrafish hearts at 6 dpf, and the red channel displayed doxorubicin or epirubicin in cells. Scale bars: 50 μm. (F) Statistics of the red fluorescence intensities in myocardial nuclei from DMSO-, doxorubicin- and epirubicin-treated zebrafish larvae (n=16), means±s.e.m., with statistical differences being determined by one-way ANOVA. NS, no significant changes. |