
Fig. 5
- ID
- ZDB-FIG-171004-24
- Publication
- Yao et al., 2017 - Screening in larval zebrafish reveals tissue-specific distributions of fifteen fluorescent compounds
- Other Figures
- All Figure Page
- Back to All Figure Page
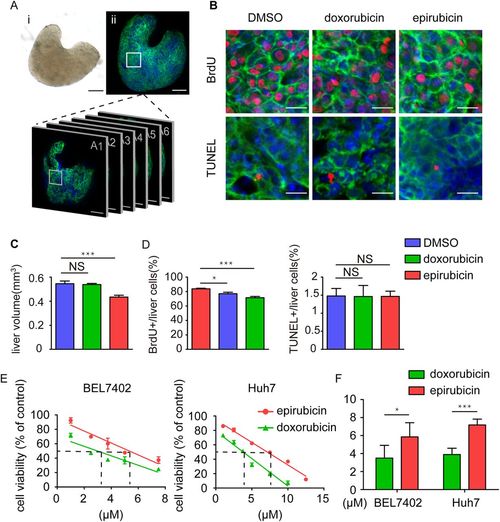
Effects of doxorubicin and epirubicin on proliferation and apoptosis in the hyperplastic livers of transgenic zebrafish larvae. (A) An example of the whole liver after dissection in both bright-field and fluorescent images. Scale bars: 50 μm. (B) Representative images of BrdU and TUNEL staining in the DMSO-, doxorubicin- and epirubicin-treated zebrafish liver with EGFP-krasG12V over-expression. Scale bars: 10 μm. (C) Statistics of the DMSO-, doxorubicin- and epirubicin-treated liver size from the transgenic larvae (n=16). The values are means±s.e.m., with statistical differences being determined by one-way ANOVA, ***P<0.001; NS, not significant. (D) Statistics of BrdU and TUNEL labelling in the DMSO-, doxorubicin- and epirubicin-treated zebrafish liver with EGFP-krasG12V over-expression (n=16). The values are means±s.e.m., with statistical differences being determined by one-way ANOVA; *P<0.05, ***P<0.001; NS, not significant. (E) The cytotoxicity of doxorubicin and epirubicin in the liver cancer cells BEL7402 and Huh7 using the MTT assay. The dashed lines are the IC50 values for each compound. (F) The statistical results of the IC50 of doxorubicin and epirubicin in the liver cancer cells BEL7402 and Huh7. The values are means±s.e.m., with statistical differences being determined by Student's t-test; *P<0.05, ***P<0.001. |