
FIGURE
Fig. 2
Fig. 2
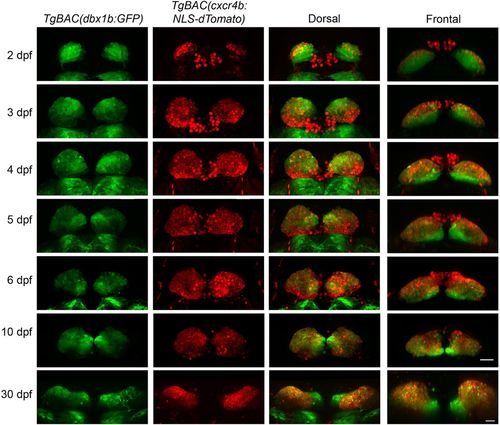
Temporal switch in dbx1b and cxcr4b expression in the developing dHb. Relative positions of dbx1b+ and cxcr4b+ cell populations revealed by TgBAC(dbx1b:GFP) and TgBAC(cxcr4b:nls-dTomato) labeling, respectively, between 2 and 30 dpf. Merged images are shown in dorsal and frontal views. Scale bars: 30 µm. |
Expression Data
| Genes: | |
|---|---|
| Fish: | |
| Anatomical Term: | |
| Stage Range: | Long-pec to Days 30-44 |
Expression Detail
Antibody Labeling
Phenotype Data
Phenotype Detail
Acknowledgments
This image is the copyrighted work of the attributed author or publisher, and
ZFIN has permission only to display this image to its users.
Additional permissions should be obtained from the applicable author or publisher of the image.
Full text @ Development