
Fig. 1
- ID
- ZDB-FIG-170706-16
- Publication
- Pei et al., 2016 - Additive reductions in zebrafish PRPS1 activity result in a spectrum of deficiencies modeling several human PRPS1-associated diseases
- Other Figures
- All Figure Page
- Back to All Figure Page
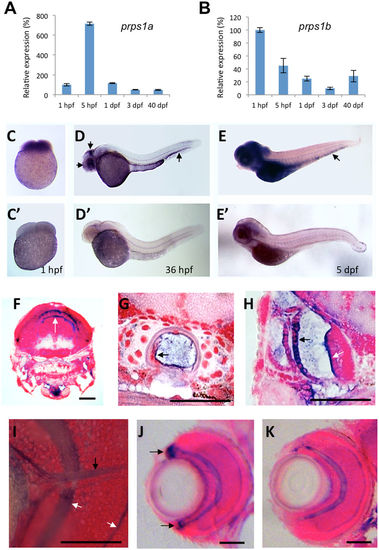
prps1a and prps1b expression in early zebrafish development. (A,B) qRT-PCR analysis of prps1a (A) and prps1b (B) expression at five developmental stages. 20 embryos at stages 1 hpf, 5 hpf, 1 dpf, 3 dpf, or 3 juvenile fish at 40 dpf were pooled together for total RNA extraction, and then qRT-PCR analysis. The internal reference used for qPCR is β–actin, whose expression may vary from maternal to zygotic stages but suffices to compare temporal expression differences between genes. Graphs show the mean and standard deviation, with the relative expression level at each timepoint normalized to 1 hpf (100%). (C–E) Whole mount in situ hybridization analysis of prps1a expression at the 1 hpf (C), 36 hpf (D), and 5 dpf (E). 15 embryos per group were used for in situ hybridization analysis. Representative images are shown for the antisense (C–E) and sense probes (C'–E'). Three arrows in D point to the enrichment in the eye, tectum and hematopoetic tissue. Images in (E,E') are from an extended staining to show the expression in the hematopoietic tissue (arrow in E). (F–I) Histological sections reveal prps1a expression in the brain (F), notochord (G), inner ear (H), and optic nerve (I). prps1a and prps1b expression was very similar, therefore representative prps1a images are shown. White arrow in F points to the enrichment in two stripes in the dorsal brain. Black arrow in G points to the enrichment in cells of the notochord. Black arrow and white arrow in H point to in the outer otic vesicle epithelium and the sensory epithelium of cristae of the inner ear, respectively. White arrows in I point to the retinal inner and outer plexiform layers, and the black arrow in I points to the optic nerve, all of which show relatively elevated levels of prps1a expression. (J,K) Histological sections reveal enriched prps1a expression in the retinal cilliary marginal zone, black arrows in J points to the expression of prps1a in ciliary marginal zone (J), but prps1b is not expressed in the CMZ (K). Images in (F–K) were obtained from in situ stained 5-day old embryos that were transversely sectioned and then counterstained with nuclear fast red. Scale bars in (F–K), 50 μm. |
| Genes: | |
|---|---|
| Fish: | |
| Anatomical Terms: | |
| Stage Range: | 4-cell to Days 30-44 |