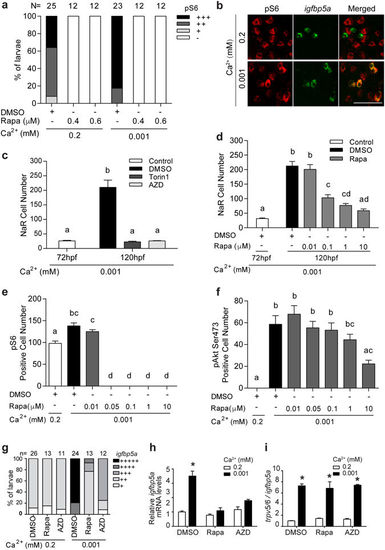
Activation of Tor signaling in NaR cells is required for their proliferation under low [Ca2+] stress. (a) Low [Ca2+] stress increases Tor signaling. 72 hpf wild type larvae were transferred to the indicated solutions. After 24 hours, they were stained using a pS6 antibody, and the results were quantified following the score system shown in Supplemental Fig. S7a. The total numbers of larvae are shown on the top of each column. (b) Low [Ca2+] activates Tor signaling in NaR cells. Larvae described in (a) were analyzed by pS6 immunostaining (red, left panel) and in situ hybridization for igfbp5a mRNA expression (green, middle panel). Merged views are shown in the right panel. (c) Tor inhibition abolishes NaR cell proliferation under low [Ca2+] stress. 72 hpf Tg(igfbp5a:GFP) larvae were treated and analyzed as described in Fig. 6. Inhibitors used are Torin1 (1 μM) and AZD8055 (AZD, 1.25 μM). (d) Dose-dependent effects of rapamycin (Rapa). Data shown are mean ± SEM, n = 10–13. Different letters indicate statistically significant differences at p < 0.05. (e,f) Different effects of rapamycin on Tor and pAkt signaling. Wild type larvae (72 hpf) were transferred to 0.2 mM or 0.001 mM [Ca2+] embryo rearing solution containing the indicated doses of rapamycin. 24 hours later, they were stained using anti pS6 (e) or pAkt antibodies (f). Values shown in (b–f) are mean ± SEM. Different letters indicate significant differences at p < 0.05, n = 10–15. (g–i) Inhibition of Tor signaling abolishes NaR cell proliferation (g) and igfbp5a mRNA expression (h) but not trpv5/6 mRNA expression (i). Wild type larvae (72 hpf) were transferred to 0.2 mM or 0.001 mM [Ca2+] embryo rearing solution containing DMSO, rapamycin (0.6 μM) or AZD8055 (1 μM), and raised to 120 hpf. NaR cells were labeled by in situ hybridization for igfbp5a mRNA and scored according to a published scoring system25. The total numbers of larvae analyzed are shown on the top. The mRNA levels of igfbp5a (h) and trpv5/6 (i) were measured by qPCR and normalized by the β-actin and igfbp5a mRNA levels, respectively. Values shown are mean ± SEM, n = 3. *p < 0.001 compared with the corresponding normal [Ca2+] control group.
|
