|
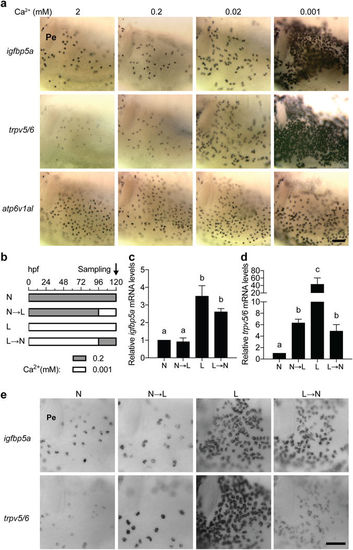
The igfbp5a gene is specifically expressed in NaR cells. (a) Wild type zebrafish embryos were raised in embryo rearing solution containing the indicated [Ca2+] from 0 to 120 hpf (hours post fertilization) and analyzed by whole-mount in situ hybridization using the indicated probes. Images shown are the yolk sac region. Scale bar = 50 μm. Unless specified otherwise, all in situ hybridization images shown hereafter are lateral views, anterior to the left and dorsal up. (b–e) The trpv5/6 and igfbp5a genes respond differentially to [Ca2+] changes. The experimental design is shown in (b). The mRNA levels of igfbp5a (c) and trpv5/6 (d) were measured by qPCR and normalized by the β-actin mRNA levels. Data shown are mean ± SEM, n = 3. Different letters indicate significant differences at p < 0.05. (e) The larvae described in (b) were analyzed by in situ hybridization using the indicated probes. Representative images are shown.
|