
Fig. 5
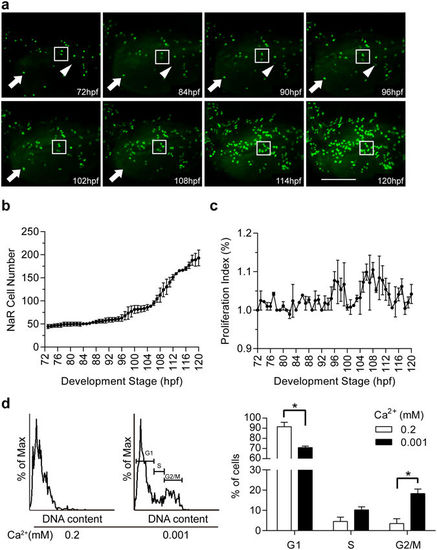
Dynamics of low [Ca2+]-induced NaR cell proliferation. Tg(igfbp5a:GFP) larvae (72 hpf) were transferred to the embryo rearing solution containing 0.001 mM [Ca2+]. Images were recorded from the same individual hourly and NaR cells numbers were determined. (a) Representative images at the indicated time points. The box shows two GFP-expressing NaR cells going through two divisions. The arrow indicates a NaR cell disappearing between 102–108 hpf. The arrowhead indicates the appearance of a new GFP-expressing cell around 86–90 hpf. (b) Average NaR cell number at the indicated time points. Values are mean ± SEM, n = 2. (c) NaR cell proliferation index at the indicated time periods. NaR cell proliferation index (%) = [(Nt − Nt−1)/Nt−1] * 100. Nt is the NaR cell number at the time of interest. Nt−1 is the NaR cell number an hour earlier. (d) Cell cycle analysis results. Left panel is a representative cell cycle histogram. Quantitative results are shown in the right panel. Values shown are mean ± SEM, n = 3, *p < 0.05. |