
FIGURE
Fig. 3
Fig. 3
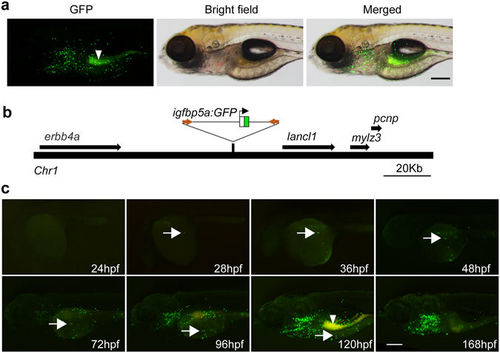
Characterization of the stable Tg(igfbp5a:GFP) fish line. (a) Lateral view of a 120 hpf transgenic Tg(igfbp5a:GFP) larva. The GFP-labeled cells are located in the yolk sac region and gills. Auto-fluorescence is indicated by an arrowhead. Scale bar = 0.2 mm. (b) Schematic diagram showing the genomic integration site. (c) Developmental pattern of GFP-labeled cells. Arrows indicate the emergence of GFP-positive cells and its subsequent location in the indicated stages. Auto-fluorescence is indicated by an arrowhead. |
Expression Data
| Gene: | |
|---|---|
| Fish: | |
| Anatomical Terms: | |
| Stage Range: | 26+ somites to Days 7-13 |
Expression Detail
Antibody Labeling
Phenotype Data
Phenotype Detail
Acknowledgments
This image is the copyrighted work of the attributed author or publisher, and
ZFIN has permission only to display this image to its users.
Additional permissions should be obtained from the applicable author or publisher of the image.
Full text @ Sci. Rep.