
Fig. S2
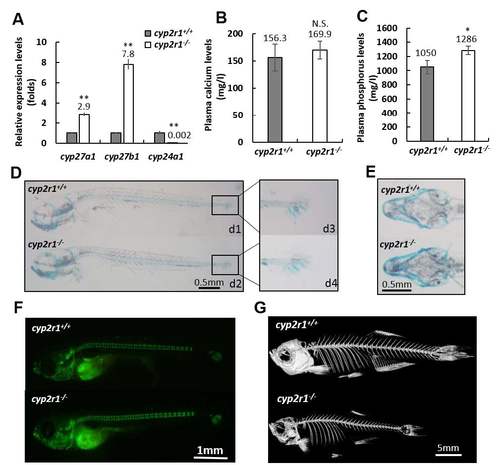
Expression levels of cyp27a1, cyp27b1 and cyp24a1 in the livers, calcium and phosphorus levels in plasma, and bone and cartilage. Related to Figure 2. (A) QRT-PCR assays show the increased cyp27a1 and cyp27b1 transcript levels and diminished cyp24a1 transcript levels in the livers of mutants and wild type siblings at 100 dpf. (B) Calcium and (C) phosphorus levels of plasma were measured in the mutants and wild type siblings at 100 dpf. (D, E) Alcian Blue for cartilage and (F) Calcein for bone staining of cyp2r1-/- zebrafish and the wild type siblings at 14 dpf. (G) MicroCT scanning of the mutants and control siblings at 100 dpf. The images are the representative result. D, lateral views; E, ventral views. The bars indicate means ± SD. *P< 0.05, **P< 0.01 versus controls, N.S., no statistically significant difference. |
| Genes: | |
|---|---|
| Fish: | |
| Anatomical Term: | |
| Stage: | Adult |
| Fish: | |
|---|---|
| Observed In: | |
| Stage Range: | Days 14-20 to Adult |