
Fig. 3
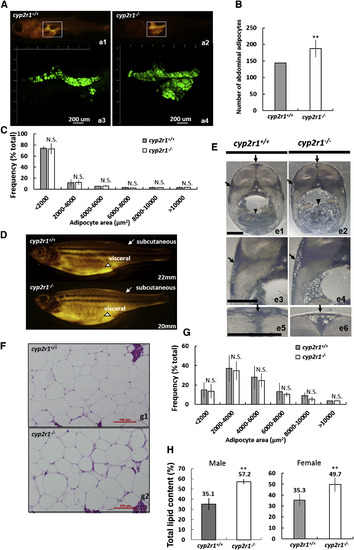
Excessive VAT Developed in cyp2r1-Deficient Fish (A) The neutral lipids of juvenile mutants and size-matched controls (both with a standard length of 7.6 mm) were stained with Nile Red and viewed with stereoscope (a1 and a2) and confocal microscope (a3 and a4). (B and C) Shown here: (B) visceral adipocyte numbers and (C) area frequency of VAT in the confocal view (a3 and a4). (D and E) Shown here: (D) Nile Red fluorescence and (E) cross-sections through trunks of adult mutants and their size-matched controls show increased subcutaneous AT (arrows) and excessive VAT (arrowheads) in the mutants. Scale bars, 1 mm. (F) H&E-stained sections of VAT of adult mutants and their size-matched controls. Scale bars, 100 μm. (G) Frequency distribution of adipocyte cell-surface area. (H) The total lipid contents of males and females of both mutants and age-matched controls at 100 dpf. cyp2r1+/+, n = 5; cyp2r1−/−, n = 4. Error bars indicate means ± SD. ∗∗p < 0.01; N.S., no statistically significant difference. See also Figure S3 and Table S3. |
| Fish: | |
|---|---|
| Observed In: | |
| Stage: | Adult |