
Fig. 3
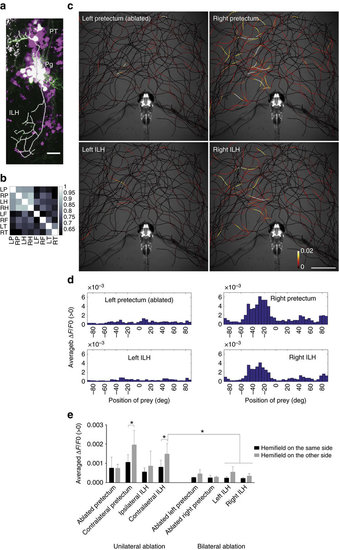
Anatomical and functional connections from the pretectum to the ILH. (a) Merged image of the pretectal cells that were sparsely labelled by the injection of UAS:EGFP DNA (EGFP in green) in the UAS:RFP; gSAzGFFM119B background (red fluorescent protein shown in magenta). The axonal projection of a single pretectal cell is shown as a thick white line. Scale bar, 20 μm. (b) Correlation of the activity of the pretectum and ILH. UAShspzGCaMP6s; hspGFFDMC76A; gSAzGFFM119B double Gal4 transgenic larvae were imaged and the cross-correlation coefficients of the calcium signals in the specified areas were calculated (Colour-coded, 1: highest correlation, 0: no correlation). (c) Activities in the pretectum and ILH in the presence of a paramecium in a 5 d.p.f. larva that was embedded in agarose. The trajectories of a single paramecium over 318 s are shown with colour-coded changes in the intensity of GCaMP6s fluorescence in a 5 d.p.f. UAShspzGCaMP6s; hspGFFDMC76A; gSAzGFFM119B double Gal4-transgenic larva that was subjected to laser ablation of the left pretectum. Scale bar, 1 mm. (d) Preference for the azimuthal position of the paramecium. (e) Left-right hemifield preference in the pretectum and ILH in 5 d.p.f. larvae that were subjected to unilateral pretectum ablation (bar graphs on the left) and abolition of the neuronal activity by bilateral pretectum ablation (bar graphs on the right). Mean±s.d. The asterisks indicate significant differences. ‘Contralateral pretectum’: unilaterally ablated larvae n=6, two-tailed t-test, P=0.0261. ‘Contralateral ILH’: unilaterally ablated larvae n=6, two-tailed t-test, P=0.0325. ‘Contralateral ILH’—‘Left ILH’ and ‘Right ILH’: bilaterally ablated larvae n=4, Tukey’s HSD test, less than P<0.0034 for all 4 groups. On the x-axis are the brain areas on which ROIs were set to measure the GCaMP6s fluorescence intensities. |