
Fig. 2
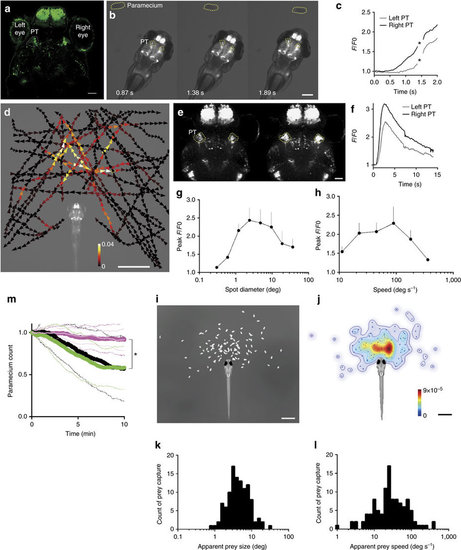
Activity in a subset of cells in the pretectal area in the presence of prey. (a) UAS:EGFP reporter gene expression in the pretectal area (PT, encircled in dotted lines) in gSAzGFFM119B Gal4 larva at 5 d.p.f. Scale bar, 50 μm. (b) Pretectal activation in response to prey at 4 d.p.f. GCaMP6s fluorescence images. Scale bar, 500 μm. (c) GCaMP6s fluorescence intensity in the pretectal areas shown in b. Asterisks: missed data points due to large movements of the larva. (d) Averaged activity of the bilateral pretectal areas in the presence of prey in a 6 d.p.f. larva embedded in agarose. The trajectories of a single paramecium over 107 s with colour-coded changes in the intensity of GCaMP6s fluorescence in the pretectal areas. Scale bar, 1 mm. (e) Confocal images showing pretectal activation in response to a moving spot. Scale bar, 50 μm. (f) GCaMP6s fluorescence intensity obtained from the time-lapse images in e. A moving spot of 2.4° in diameter was presented to a larva at a speed of 100 deg s−1 from 0.3 to 3.4 s. (g,h) Size-tuning and speed–tuning curve, respectively (n=6 larvae at 4 d.p.f.; Mean±s.e.m.). Maximal responses to a moving spot. The x-axis is logarithmically scaled. (i) Relative positions of the paramecium at the onset of prey capture in free-swimming larvae at 5 d.p.f. (n=110 successfully completed prey capture events by 6 larvae). Scale bar, 1 mm. j, Probability density of the paramecium positions shown in i. Colour bar:0 (blue) and 9 × 10⁻⁵ (red). Scale bar, 1 mm. (k,l) Histograms of the apparent sizes and speeds, respectively, of the prey at the onset of prey capture from the data shown in i. (m) Paramecium consumption in the UAS:EGFP; gSAzGFFM119B larvae that were subjected to bilateral pretectal ablation (n=10, thick magenta line) or unilateral (n=10, thin light-magenta line), UAS:EGFP; gSAzGFFM119B larvae subjected to bilateral olfactory bulb ablation (n=11, green) and UAS:EGFP; gSAzGFFM119B larvae (no laser irradiation, n=8, black). Solid lines:mean. Dotted lines: s.d. Asterisks: significant differences between each of pretectum ablation groups and each of control groups at 10 min (Tukey’s HSD test, P=0.0016 for bilateral pretectum ablation and olfactory bulb ablation). |