
Fig. S9
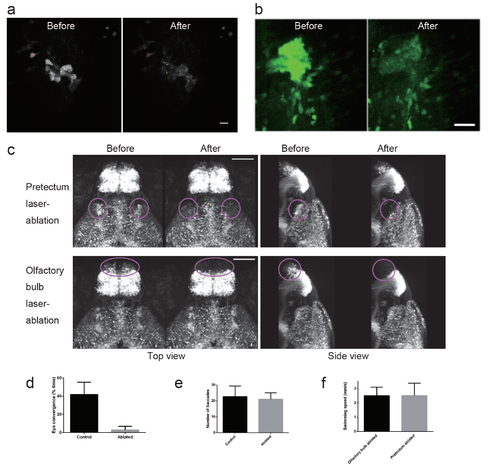
Ablation of the pretectal cells in UAS:EGFP;gSAIzGFFM119B larvae a, Images of the EGFP fluorescence of the pretectal cells on a focal plane before and after two-photon laser ablation in a 4 dpf UAS:EGFP;gSAIzGFFM119B larva. The targeted cells are labelled with small coloured circles. Scale bar: 10 μm. b, Image of the EGFP fluorescence of the pretectal cells in a UAS:EGFP;gSAIzGFFM119B larva. z-stack images that covered the entire gregion of the 119B-labelled pretectal cells were projected onto one image. Before (left) and after (right) laser ablation. Scale bar: 25 μm. c, Absence of fluorescent cells after laser ablation. Top panel: pretectum ablation (encircled in magenta). Bottom panel: olfactory bulb ablation (encircled in magenta) as a control experiment. Scale bar: 100 μm. d, Eye convergence (indicator of prey capture, mean ± S.D.; Control, n = 3 untreated larvae; Ablated, n = 5 pretectum-ablated larvae; two-tailed ttest, p = 0.0008). e, Optokinetic response (mean ± S.D.; Control, n = 8 untreated larvae; Ablated, n = 6 pretectum-ablated larvae; two-tailed t-test p = 0.5920). f, Locomotor activity in olfactory bulb-ablated larvae (n=11) and pretectum-ablated larvae (n=10). The average swimming speeds in 10 min recordings are shown with S.D. |