
Fig. 4
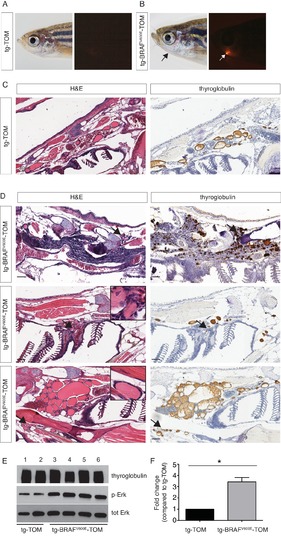
Analysis of a cohort of transgenic zebrafish expressing BRAFV600E in thyrocytes at 5 months post fertilization. (A–B) Photographs and epifluorescent photographs of live five mpf tg-TOM (A) and Tg-BRAFV600E-TOM fish (B) reveals TdTomato-positive tissue. (C) Representative H&E and IHC using anti-thyroglobulin antibody of sagittal section of adult fish tg-TOM at five mpf. (D) Representative images from three tg-BRAFV600E-TOM adult fish at five mpf demonstrating the presence of invasive carcinoma. Top panel, mass of Tg-positive thyroid cells (arrows) invading muscle. Middle panel, thyroid cells invading gill tissue (arrows), inset is 40X. Lower panel, thyroid cells invading subcutaneous fat in the ventral jaw (arrows), inset is 40X. (E) Western blot analysis of thyroid obtained from two tg-TOM (control) and four tumors bearing tg-BRAFV600E-TOM zebrafish. Western blot analysis was performed in duplicate, a representative blot is shown. (F) Quantitative analysis of fold change in pERK/total ERK from (E), p<0.05, Student’s t-test. |
| Gene: | |
|---|---|
| Antibodies: | |
| Fish: | |
| Anatomical Term: | |
| Stage: | Adult |
| Fish: | |
|---|---|
| Observed In: | |
| Stage: | Adult |