
Fig. 2
- ID
- ZDB-FIG-170209-15
- Publication
- Sotolongo-Lopez et al., 2016 - Genetic Dissection of Dual Roles for the Transcription Factor six7 in Photoreceptor Development and Patterning in Zebrafish
- Other Figures
- All Figure Page
- Back to All Figure Page
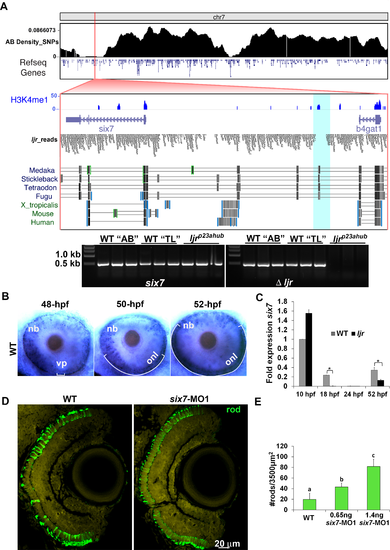
six7 knockdown phenocopies the increase and uniform distribution of rods from ljrp23ahub mutants. (A) Frequency of SNPs across chromosome 7 relative to the TL reference genome (danRer7) calculated from whole-genome sequencing of a pool of DNA extracted from 118 ljrp23ahub mutants where TL is the reference background. Below, 75 kb view of the SNP-depleted region on chromosome 7. A 2.4 kb region depleted of uniquely-aligning reads is highlighted in teal. Shown are tracks for H3K4me1 [63], read alignments from whole-genome sequencing of ljrp23ahub mutants, and multiz-based sequence conservation UCSC genome browser tracks of six7 across four fish species and Six3 in frog, human, and mouse [72]. Gel electrophoresis of PCR products of six7 exon 1 and the upstream genomic region amplified from AB, TL and ljrp23ahub genomic DNA. (B) Whole mount in situ hybridization shows six7 expression confined to retinal neuroblasts and differentiating ONL spatially and temporally with photoreceptor genesis. Dorsal is up. (C) Quantitative RT-PCR (qRT-PCR) performed on mRNA from control (WT) and ljrp23ahub embryos at 10 hpf, 18 hpf, 24 hpf and 52 hpf reveal down regulation of six7 expression in ljrp23ahub at 52 hpf. Relative transcript abundance was normalized to actin levels and is presented as the mean fold change in expression relative to 10 hpf controls (n = 30 embryos per group). All the real-time PCR experiments were carried out in triplicate. Significant differences observed at 18 hpf and 52 hpf, Student’s t test, *p<0.05. (D) Retinal cryosection from 4 dpf un-injected control WT and six7-MO1 injected embryos immunolabeled for rods (4C12, green). six7-morphants display an increase in the number of rods as detected in ljrp23ahub. Note the lack of gaps in rod distribution in the central retina of six7-knockdown larvae. (E) Graph showing dosage dependent increase in the average number of rods per unit area dorsal to the optic nerve of WT and six7-MO1 injected embryos (WT un-injected, n = 4; six7-MO1, n = 6, each dose), One-way ANOVA with Tukey’s post-hoc test. a vs b, p<0.05, b vs c, p<0.001, a vs c, p<0.0001. Error bars represent SD. nb, neuroblast; vp, ventral patch; onl, outer nuclear layer; MO1, morpholino 1. |
| Gene: | |
|---|---|
| Antibody: | |
| Fish: | |
| Knockdown Reagent: | |
| Anatomical Terms: | |
| Stage Range: | 14-19 somites to Day 4 |
| Fish: | |
|---|---|
| Knockdown Reagent: | |
| Observed In: | |
| Stage Range: | 14-19 somites to Day 4 |