
Fig. 1
- ID
- ZDB-FIG-170208-28
- Publication
- Shamay-Ramot et al., 2015 - Fmrp Interacts with Adar and Regulates RNA Editing, Synaptic Density and Locomotor Activity in Zebrafish
- Other Figures
- All Figure Page
- Back to All Figure Page
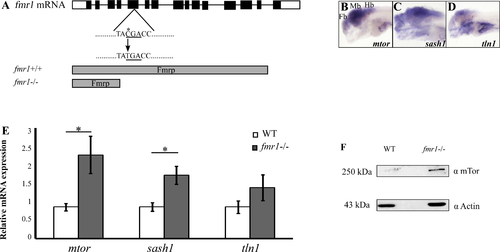
Increased expression of Fmrp-target genes in fmr1-/- zebrafish. A. The full mRNA sequence of the fmr1 gene, including the CDS (black bars) and UTRs (white bars). A single C-to-T mutation at position 113 results in a premature stop codon and truncated protein (gray bars). B-D. Whole-mount ISH assays show the spatial expression of mtor, sash1, and tln1 in 6 dpf WT larvae. Fb, forebrain; Mb, midbrain; Hb, hindbrain. E. Relative mRNA expression of mtor, sash1, and tln1 in 6 dpf fmr1-/- (grey bars) and WT larvae (white bars). Values are represented as means ± SEM (*p<0.05, two-way t-test assuming unequal variances). F. Western blots show an approximate five-fold increase in the expression of mTor protein levels in fmr1-/- zebrafish brain tissue. |
| Genes: | |
|---|---|
| Antibodies: | |
| Fish: | |
| Anatomical Terms: | |
| Stage: | Day 6 |
| Fish: | |
|---|---|
| Observed In: | |
| Stage: | Day 6 |