
- Title
-
Fmrp Interacts with Adar and Regulates RNA Editing, Synaptic Density and Locomotor Activity in Zebrafish
- Authors
- Shamay-Ramot, A., Khermesh, K., Porath, H.T., Barak, M., Pinto, Y., Wachtel, C., Zilberberg, A., Lerer-Goldshtein, T., Efroni, S., Levanon, E.Y., Appelbaum, L.
- Source
- Full text @ PLoS Genet.
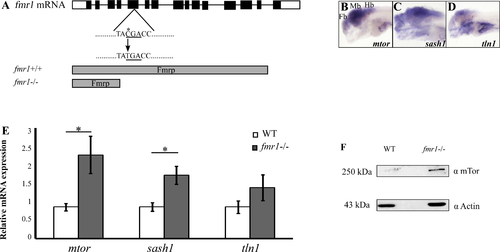
Increased expression of Fmrp-target genes in fmr1-/- zebrafish. A. The full mRNA sequence of the fmr1 gene, including the CDS (black bars) and UTRs (white bars). A single C-to-T mutation at position 113 results in a premature stop codon and truncated protein (gray bars). B-D. Whole-mount ISH assays show the spatial expression of mtor, sash1, and tln1 in 6 dpf WT larvae. Fb, forebrain; Mb, midbrain; Hb, hindbrain. E. Relative mRNA expression of mtor, sash1, and tln1 in 6 dpf fmr1-/- (grey bars) and WT larvae (white bars). Values are represented as means ± SEM (*p<0.05, two-way t-test assuming unequal variances). F. Western blots show an approximate five-fold increase in the expression of mTor protein levels in fmr1-/- zebrafish brain tissue. |

Hyperlocomotor activity and altered response to dark-to-light transition in fmr1-/- larvae. A. Locomotor activity (cm/min) recording was performed in 6 dpf fmr1-/- larvae (black line) and WT larvae (grey line) throughout a daily cycle under a 14 h light/10 h dark cycle. fmr1-/- larvae are hyperactive during both day and night (WT, n = 30; fmr1-/-, n = 34, ***p<0.0001). B.Average total activity (cm/min) during both day and night is presented for 6 dpf fmr1-/- and WT larvae. Values are represented as means ± SEM (*p<0.05, two-way t-test assuming unequal variances). C. Larvae were kept under alternating 30-min light/dark cycles during the day. The fmr1-/- larvae were hyperactive compared with WT larvae during the light periods (WT, n = 177; fmr1-/-, n = 179). D. Total average activity under alternating 30-min light/dark cycles during the day during both light and dark periods, is presented for 6 dpf fmr1-/- larvae and WT larvae. Values are represented as means ± SEM (*p<0.05, two-way t-test assuming unequal variances). E. Transition analysis demonstrating the differences in total average activity per genotype, calculated by comparing 5 min after and 5 min before light-to-dark and dark-to-light transitions. While the WT larvae showed reduced activity, the fmr1-/- larvae showed increased activity during the dark-to-light transitions (**p<0.005). Values are represented as means ± SEM. Statistical significance was determined by using a two-way t-test assuming unequal variances. PHENOTYPE:
|
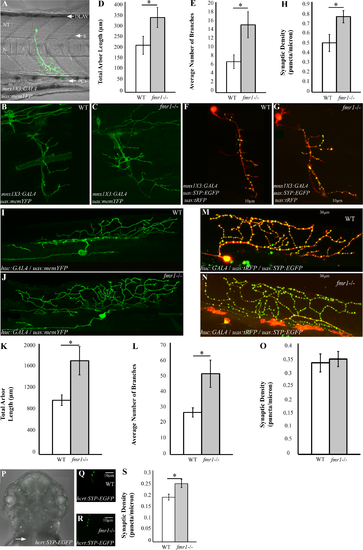
Increased synaptic density and axon branching in the CNS of fmr1-/- embryos. A. Wide-angled view of a confocal generated image of a single motor neuron in a 2 dpf embryo, which transiently expresses mnx1X3:GAL4 and uas:tRFP constructs. DLAV, dorsal lateral anastomotic vessel; N, notochord; NT, neural tube; PVC, posterior cardinal vein; S, somite. B-C. Confocal imaging of motor neurons in 2 dpf fmr1-/- and WT embryos, which transiently express mnx1X3:GAL4 and uas:memYFP constructs. D-E. Total arbor length (D) and number of branches (E) were measured in fmr1-/- (grey bars) and WT (white bars) embryos (WT, n = 17; fmr1-/-, n = 27, *p<0.05). Values are represented as means ± SEM. F-G. Confocal imaging of motor neurons in 2 dpf fmr1-/- and WT embryos, which transiently express mnx1X3:GAL4, uas:SYP-EGFP and uas:tRFP constructs. H. Total synaptic density was measured along the last 10 μm of a single branch of motor neurons in fmr1-/- and WT embryos (WT, n = 11; fmr1-/-, n = 17, *p<0.05). Scale bar = 10 μm. Values are represented as means ± SEM. I-J. Confocal imaging of spinal Rohon-Beard (RB) sensory neurons that project dorsally in 2 dpf fmr1-/- and WT embryos, which transiently express huc:GAL4 and uas:memYFP constructs. K-L. The total arbor length (K) and number of branches (L) in the arbor of RB neurons were quantified in fmr1-/- and WT embryos (WT, n = 9; fmr1-/-, n = 10, *p<0.05). M-N. Confocal imaging of RB neurons in 2 dpf fmr1-/- and WT embryos, which transiently express huc:GAL4, uas: SYP-EGFP and uas:tRFP constructs. O. Total synaptic density was measured along the last 30 μm of a single branch of RB neurons in fmr1-/- (grey bars) and WT (white bars) embryos (WT, n = 10; fmr1-/-, n = 13). Scale bar = 30 μm. Values are represented as means ± SEM. Statistical significance was determined by two-sample t-test assuming unequal variances. P. Dorsal view of Hcrt neuron axons in a 2 dpf embryo, which transiently expresses the hcrt:SYP-EGFP construct. White arrow indicates the area analyzed. Q-R. Representative confocal imaging of Hcrt axons in 2 dpf fmr1-/- and WT embryos, which transiently express the hcrt:SYP-EGFP construct. S. Total synaptic density was measured along the last 10 μm of a single axonal branch of hcrt neurons in fmr1-/- and WT embryos (WT, n = 8; fmr1-/-, n = 9, *p<0.05). Scale bar = 10 μm. Values are represented as means ± SEM. |

Fmrp-Adar interaction in zebrafish. A. Phylogenetic tree of zebrafish and human Adar proteins. Sequences are labeled with gene names, chromosomal locations, and accession numbers. To standardize and simplify the nomenclature, we named the genes Adar1-3, as indicated on the right side of each clade. Similarity values of each Adar member appear on top of each clade. B. Sequence conservation and motif distribution of Adar proteins in zebrafish and humans. Protein domains: adenosine deaminase domain (deaminase, white), double-stranded RNA binding motif (dsRBM, black) and zDNA binding domain (z_alpha, light grey). C-R. In situ hybridization showing lateral (C, E, F, H, I, K, L, N, O, Q) and dorsal (D, G, J, M, P, R) views of the spatial expression pattern of all four adar genes in 2 dpf (C-D, F-G, I-J, L-M) and 6 dpf (E, H, K, N) WT larvae. Expression is detected primarily in the nervous system. O-R. Selected regions (black frames in L and M) show adar2b (O-P) and adar3 (Q-R) expression in the spinal cord of 2 dpf WT embryo. S. HEK-293T cells were transiently transfected with the zebrafish proteins Adar2a and Fmrp fused to EGFP and MYC, respectively (EGFP-Adar2a and MYC-Fmrp). Co-immunoprecipitation was used to detect Adar2a and Fmrp interaction. Actin was used as a negative control. The cell lysate was immunoprecipitated with anti-actin, anti-MYC, or anti-EGFP. Proteins were purified from the complexes and separated by SDS-PAGE. T. Western blot shows the protein content following the transfection prior to the immunoprecipitation. The proteins were detected with specific antibodies against MYC, EGFP, and actin. U. Computational sequence homology predicted the number of RNA recognition elements (RREs) in the CDS of adar genes that are recognized by Fmrp. V. RNA immunoprecipitation (RIP) assays show that Fmrp binds adar1. PCR amplification of adar1 on RNA extracted from a RIP experiment conducted with anti-Actin and anti-MYC antibodies, and on total RNA extracted from HEK293T cells. W. RT-PCR assays showed that the mRNA expression levels of all four adar genes increased in 6 dpf fmr1-/- larvae (grey bars) when compared with WT larvae (white bars). Values are represented as means ± SEM. *p<0.05, **p<0.005, two-way t-test assuming unequal variances. X. Adar2 protein expression was analyzed by Western blot with specific antibodies against Adar2 and actin as a loading control. Elevated Adar2 protein levels of approximately 30% are present in fmr1-/- brains. |

Targeted resequencing by mmPCR revealed differential RNA editing levels in fmr1-/- larvae. A. Schematic representation of the three major steps in the amplification and quantification of multiple RNA editing sites by next-generation sequencing. 1. A microfluidic-based PCR using the Fluidigm Access Array platform on the IFC chip (sample and primer inlets, black arrows) generates 48 targeted amplicons from 48 different samples. Schematic representation of the “on-chip” PCR; target regions (blue lines) contain a targeted RNA editing site (red circle) amplified by PCR with forward and reverse target-specific primers (TSP-F/TSP-R) fused to common sequences (CS1/CS2). 2. “Off-chip” PCR generates mini-library tagging, and the addition of IT-adaptor sequences creates 48 fully tagged and sequencer-compatible mini-libraries. Fusion primers containing CS1 and CS2 (red line primers) and the Ion Torrent PGM adaptor sequences P1 (green) and Aseq (orange) are used to generate completed amplicons (blue lines flanked by red lines). Barcode sequences (yellow) for sample indexing are fused to the Aseq-CS2 primer. 3. Parallel sequencing of the combined libraries on Ion Torrent-PGM. All mini-libraries are pooled together. B. Dot plot represents all calculated values of A/G ratios [percentages (dots) and means (black horizontal lines)] in the set of target sites that met all selection criteria in WT (blue circles) and fmr1-/- (green circles) RNA. C. The ten editing sites that exhibited significant differential RNA editing levels between fmr1-/- and WT larvae (n = 20 batches of 10 larvae for each genotype, *p<0.05, **p<0.005). D. Representative RNA editing sites showed increased editing levels in the brains of fmr1-/- zebrafish. gria3b showed a 14% increase, grik2 showed an 8% increase and ache showed an 18% increase (gria3b and grik2: WT, n = 4; fmr1-/-, n = 5; ache, n = 3 per genotype, one brain per sample, *p<0.05, **p<0.005). E-F. Genes with multiple editing sites located in close proximity in the same amplified target region, were analyzed to quantify the relative abundance of all possible protein combinations formed by the editing pattern. Grey bars represent differences in the relative abundance of mRNA transcripts between WT and fmr1-/- larvae. E. In gria2a, LR (Leucine, Arginine) represents the genomically encoded unedited version that exhibited a 2.6% difference in relative abundance (*p<0.05). F. In gria3a, AV (Alanine, Valine) represents the double-edited form that exhibited a 1.6% difference in relative abundance (*p<0.05). Values are represented as means ± SEM. Statistical significance was determined by two-sample t-test assuming unequal variances. |