
Fig. 5
- ID
- ZDB-FIG-161219-10
- Publication
- Nicolás-Pérez et al., 2016 - Analysis of cellular behavior and cytoskeletal dynamics reveal a constriction mechanism driving optic cup morphogenesis
- Other Figures
- All Figure Page
- Back to All Figure Page
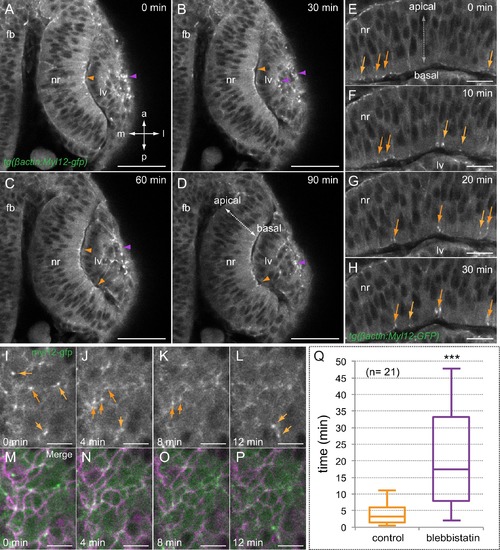
Myosin accumulates in basal foci during optic cup morphogenesis. (A–D) Live-imaging analysis of tg(actb1:myl12.1-eGFP) embryos reveals myosin accumulation at the apical lens (purple arrowheads) and basal retina (orange arrowheads) between 19 and 20.5 hpf. Antero-posterior (a–p) and medio-lateral (m-l) axes are indicated. (E–H) Myosin accumulates in transient foci (orange arrows) at the basal cortex. (I–P) Time-lapse analysis of myosin foci at the basal surface plane in embryos injected with lyn-tdTomato RNA reveals that the protein accumulates at the peripheral cortex in scattered cells. (Q) The box plot shows a significant difference in foci stability between control and blebbistatin (150 µM) treated embryos (T-test, n = 21). fb = forebrain; nr = neural retina; lv = lens vesicle. Scale bars = 50 µm in A–D, 20 µm in E–H, and 10 µm in I–P. |